.png)
Extreme Fear, High Hit-Rate: Our 1–3M SPY Edge
The Opportunity/Regime Edge
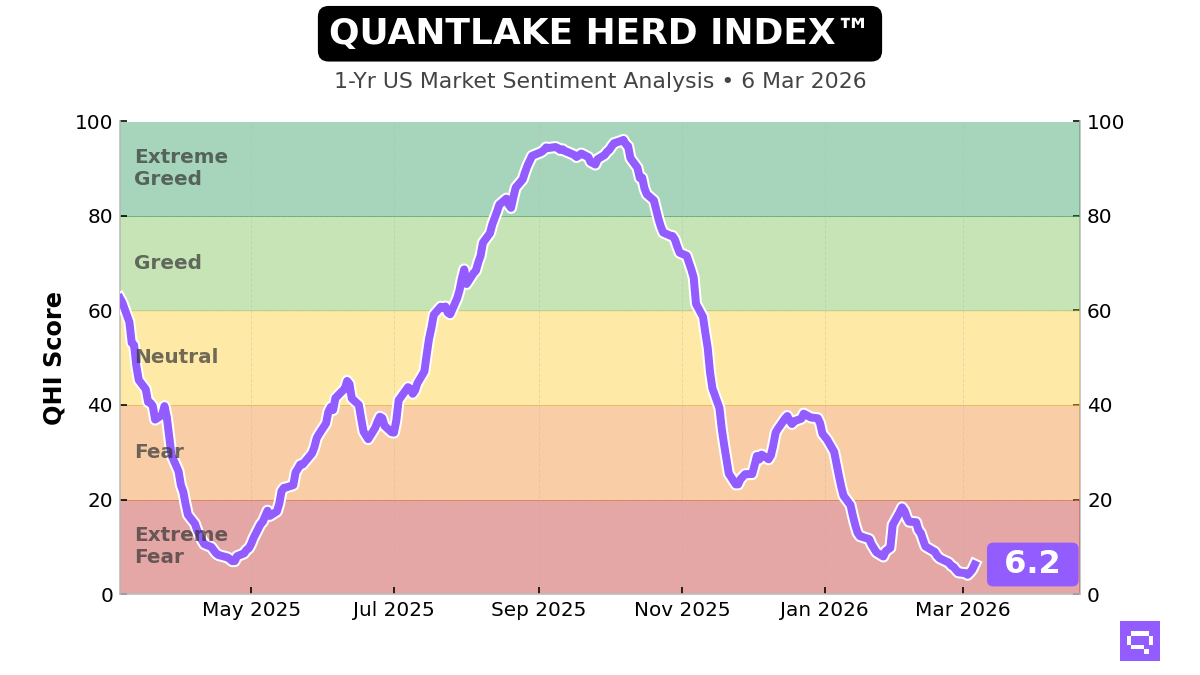
Our QHI is printing 6.2 (Extreme Fear) with a -1.55 z-score and a 2.1 percentile rank. That combination matters because it places us in the part of the sentiment distribution where the behavior gap is typically widest: investors de-risk after losses, extrapolate recent pain, and systematically under-allocate right when forward equity expectancy improves.
What this regime has meant historically for SPY forward returns (conditional on Extreme Fear):
- 1M expectancy: +2.9% mean (+2.9% median), 84.3% hit rate (n=788, t_NW=6.9)
- 3M expectancy: +6.3% mean (+6.5% median), 87.3% hit rate (n=788, t_NW=4.9)
Relative to the unconditional SPY baseline:
- 1M: +2.9% vs +1.2% baseline (about +1.7% incremental edge)
- 3M: +6.3% vs +3.6% baseline (about +2.7% incremental edge)
Risk is not absent in this regime, but it is priced: the left tail at 1M shows VaR5 of -3.4% and CVaR5 of -5.8% (3M VaR5 -5.8%, CVaR5 -9.8%). Our takeaway is straightforward: Extreme Fear has historically offered one of the cleanest “paid to be disciplined” windows for systematic equity exposure, provided sizing respects tail risk.
The Technical Context
Where we are now:
- Latest QHI: 6.2 (Friday March 6), up +1.1 pts on the day
- Zone: Extreme Fear (0–20)
- Z-score: -1.55 versus our expanding full-history mean of 49.18 (std 27.66; n=4159)
How to interpret -1.55 in practice:
- It is “notable” dislocation (fearful vs long-run norm), but not a statistical outlier beyond our ±2.0 extreme threshold.
- That’s important behaviorally: we often see better follow-through when fear is persistent and broadly internalized (capitulation-by-a-thousand-cuts), not only when it is a single-day panic print.
Regime persistence (key for discipline):
- Current Extreme Fear duration: 38 trading days
- Historical Extreme Fear duration stats: min 1, average 18.8, max 74
- Translation: we are already in a long fear regime (about 2x the average duration), but still well short of historical maxima. This is exactly where discretionary investors tend to “give up” on the signal (recency bias), while systematic processes continue to harvest the conditional expectancy.
Momentum and Volatility Dynamics
Short-term momentum is improving, but the bigger picture remains fear-dominant:
- 5D change: +1.7 pts (a bounce)
- 10D change: -1.1 pts (still weaker over two weeks)
- 20D change: -10.0 pts (fear has deepened materially over a month)
Streak behavior:
- Current streak: 3 consecutive up days
- This up-streak is longer than only 20.7% of historical up-streaks (i.e., not an unusually persistent rebound yet)
- Average up streak: 7.2 days; longest historical up streak: 52 days
Volatility compression (often overlooked, but crucial here):
- 1-month QHI standard deviation: 4.0 vs historical average 7.6 (0.53x)
- Interpretation: sentiment is not just fearful; it is “quietly” fearful. That tends to reflect resignation and position underweighting rather than a one-off shock. In our experience, this is where the behavior gap becomes structural: investors wait for “clarity,” but the market’s forward returns are often realized during the uncomfortable transition from fear to merely less fear.
Putting it together:
- We have Extreme Fear levels (strong conditional forward expectancy) plus early signs of stabilization (3-day up streak, 5D improvement) while the 20D trend confirms the crowd is still anchored to the drawdown narrative.
- This is the setup where systematic discipline tends to outperform discretionary timing: the crowd demands confirmation; the edge historically accrues before confirmation arrives.
Accessing Our Data
For systematic investors, the full QHI historical dataset is available via the Quantlake API, enabling direct integration into portfolio construction, signal research, and risk monitoring workflows.
Romain Gandon
CEO, Quantlake
Financial disclaimer: This report is for informational and educational purposes only and does not constitute investment advice.