.png)
Leadership Narrows as Bonds Broaden
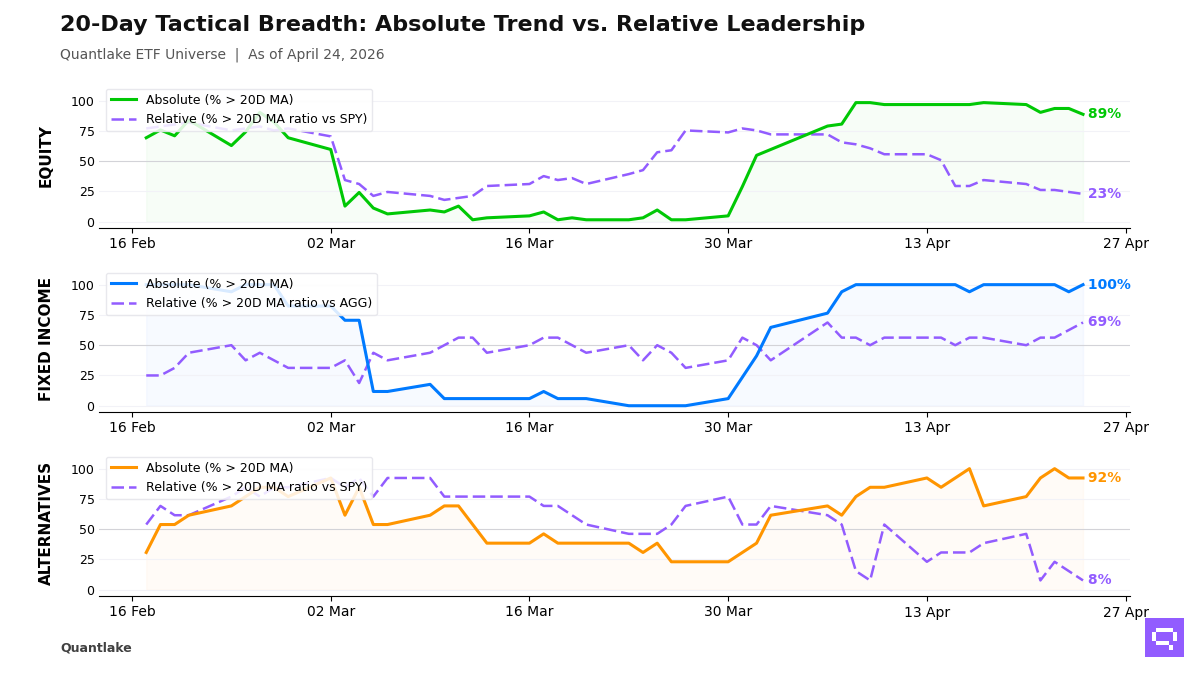
At Friday's close, our ETF universe still looked benchmark-led rather than genuinely broad. In equities, 55 of 62 ETFs (89%, -4.8pp on the day) held above their 20-day moving average, but only 14 of 61 (23%, -1.6pp) outperformed their benchmark, leaving a +66pp gap as leadership stayed concentrated in US growth, momentum and select Asia/EM names, including Emg. Markets EEM. Fixed income moved the other way: 17 of 17 ETFs (100%, +5.9pp) held above their 20-day moving average and 11 of 16 (69%, +6.2pp) outperformed, a much healthier +31pp gap and the only clearly broad participation across our coverage.
Alternatives are the main check on confirmation, with 12 of 13 ETFs (92%, unchanged on the day) above their 20-day moving average but just 1 of 13 (8%, -7.7pp) ahead of its benchmark, an +85pp gap that leaves commodities, real estate and diversified alternatives rising without leadership. We also saw Global Min Vol ACWV, High Dividend DVY and Biotechnology IBB break below their 20-day moving averages, while Long Treasuries TLT reclaimed its own and Oil USO lost relative ground, so our conviction is capped by narrow equity leadership and weak relative follow-through outside bonds.
20-Day Tactical Breadth
Key Takeaways
• We see the cleanest equity leadership in the names aligned across daily, weekly and monthly relative strength: emerging markets (EEM), Taiwan equity (EWT), South Korea equity (EWY), global equity (ICLN), US equity (IWM, IYW, PAVE, QQQ), momentum factor (MTUM), US/Global equity (SMH), value factor (VLUE) and Technology sector (XLK). Within that group, Emg. Markets EEM crossed above its SPY ratio 20-day moving average with a +3.8% 20-day relative return, while Small-Cap Core IJR and US Broad Market VTI crossed below theirs with negative 20-day relative returns.
• We read fixed income as a spread-and-front-end leadership profile, not a Treasury-led one. Across timescales, EM debt, high-yield credit, investment grade, munis, preferreds, inflation-linked bonds and short-duration are carrying the bucket, while government/treasury and long-duration lag AGG; Global Bonds BNDX crossed above its AGG ratio 20-day moving average, but with a -0.3% 20-day relative return that move reads as early stabilization rather than leadership.
• We see the weakest confirmation in alternatives. Most alternatives names remain above their 20-day moving average, yet the persistent relative laggards are agriculture (DBA), long/short equity (FTLS), real estate (VNQ, XLRE) and several commodity-linked exposures; Oil USO crossed below its SPY ratio 20-day moving average despite a +2.0% 20-day relative return, which marks fading leadership rather than outright breakdown.
FEATURED ETF — iShares MSCI Emerging Markets ETF EEM vs SPY

Other Technical Signal Events
EQUITY
Absolute Price Signals
Below 20D moving average
• iShares Biotechnology ETF IBB (20D perf: +2.74%)
• iShares MSCI Global Min Vol Factor ETF ACWV (+1.66%)
• iShares Select Dividend ETF DVY (+1.26%)
Relative Strength Signals (vs SPY)
Above 20D moving average
• iShares MSCI Emerging Markets ETF EEM (20D relative perf: +3.83%)
Below 20D moving average
• Vanguard Total Stock Market VTI (20D relative perf: -0.14%)
• iShares Core S&P Small-Cap ETF IJR (-0.42%)
FIXED INCOME
Absolute Price Signals
Above 20D moving average
• iShares 20+ Year Treasury Bond ETF TLT (20D perf: +1.10%)
Relative Strength Signals (vs AGG)
Above 20D moving average
• Vanguard Total International Bond BNDX (20D relative perf: -0.26%)
ALTERNATIVES
Relative Strength Signals (vs SPY)
Below 20D moving average
• United States Oil Fund LP USO (20D relative perf: +2.02%)
Romain Gandon
CEO, Quantlake
Disclaimer: This report is for informational and educational purposes only and does not constitute investment advice.