.png)
Dividend ETFs Lead as Small-Cap Value Joins Rotation
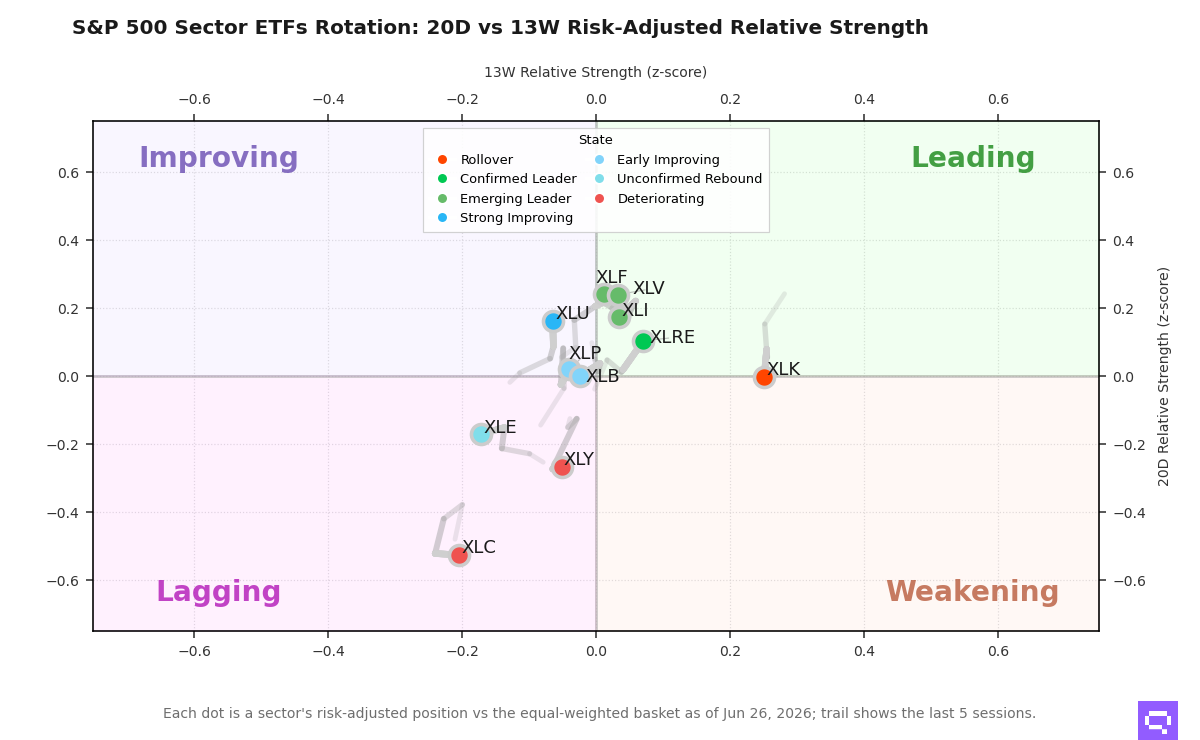
Dividend leadership held, but the week’s rotation broadened modestly versus the prior week as small-cap value joined the positive cluster and mid-cap growth slipped back below zero. Large-cap growth remained the clear laggard, leaving the tape narrow and defensive in our universe.
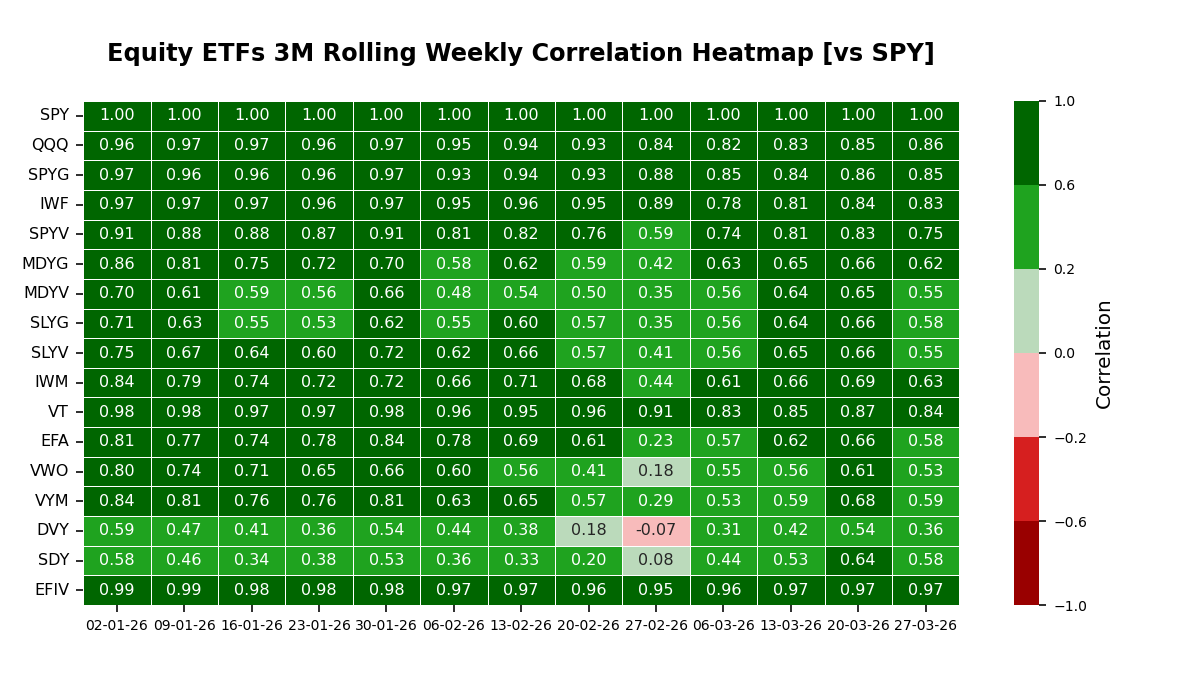
That leadership looks less like a single beta trade because correlation to SPY for the key dividend leaders sits below their 1-year mean alongside sizable alpha contribution. iShares Select Dividend ETF (DVY) shows correlation to SPY of 0.36 versus 0.66 with 10.0 points of alpha contribution, while SPDR S&P Dividend ETF (SDY) shows 0.58 versus 0.65 with 11.1 points of alpha.
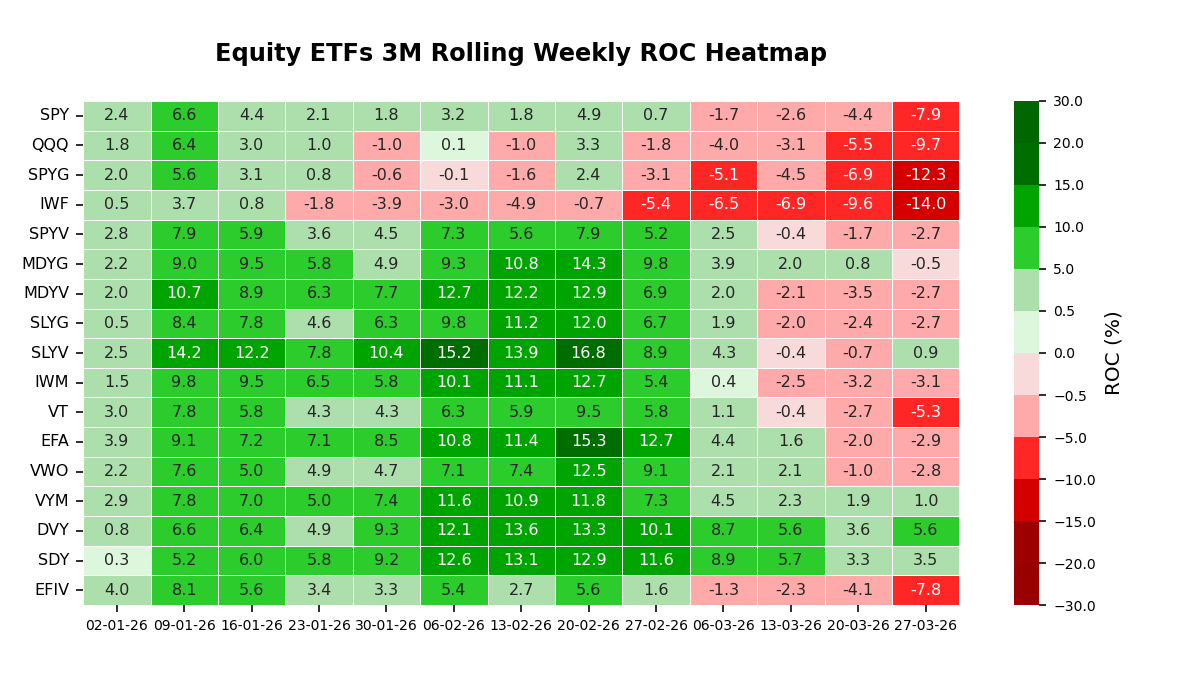
Over the week, breadth remained soft, with 12 of the ETFs we track posting weaker 3-month trailing momentum. DVY (Δ +2.0 points), SLYV (Δ +1.6), and MDYV (Δ +0.8) accelerated. SPYG (Δ -5.4), IWF (Δ -4.4), and QQQ (Δ -4.2) decelerated. SLYV flipped positive, while SPDR Portfolio S&P 400 Mid Cap Growth ETF (MDYG) flipped negative.
Across levels, DVY and SDY sit in the top decile, with Vanguard High Dividend Yield ETF (VYM) and SLYV in the upper third as the only other names above zero. MDYG is now just below zero, while QQQ, SPYG, and IWF remain clustered in the bottom decile.
Stress remains concentrated in international developed: iShares MSCI EAFE ETF (EFA) is statistically depressed at a 1-year Z-score of -2.26 and sits at its 12-month trough, flagging normalization risk rather than a directional call. VWO, VT, SPYG, and IWF are depressed but not extreme, while DVY and SDY are near neutral versus their own 1-year averages.
Attribution continues to support idiosyncratic leadership at the top, with DVY and SDY combining lower correlation to SPY than their 1-year mean and double-digit alpha contribution. By contrast, the weakest growth complex behaves more like a beta proxy, with QQQ and SPYG showing high correlation to SPY and negative alpha contribution.
Our take: The prior week’s dividend-led, alpha-forward framework extends, but the SLYV flip positive alongside MDYG flipping negative adds a clearer size and style rotation signal inside an otherwise narrow tape.
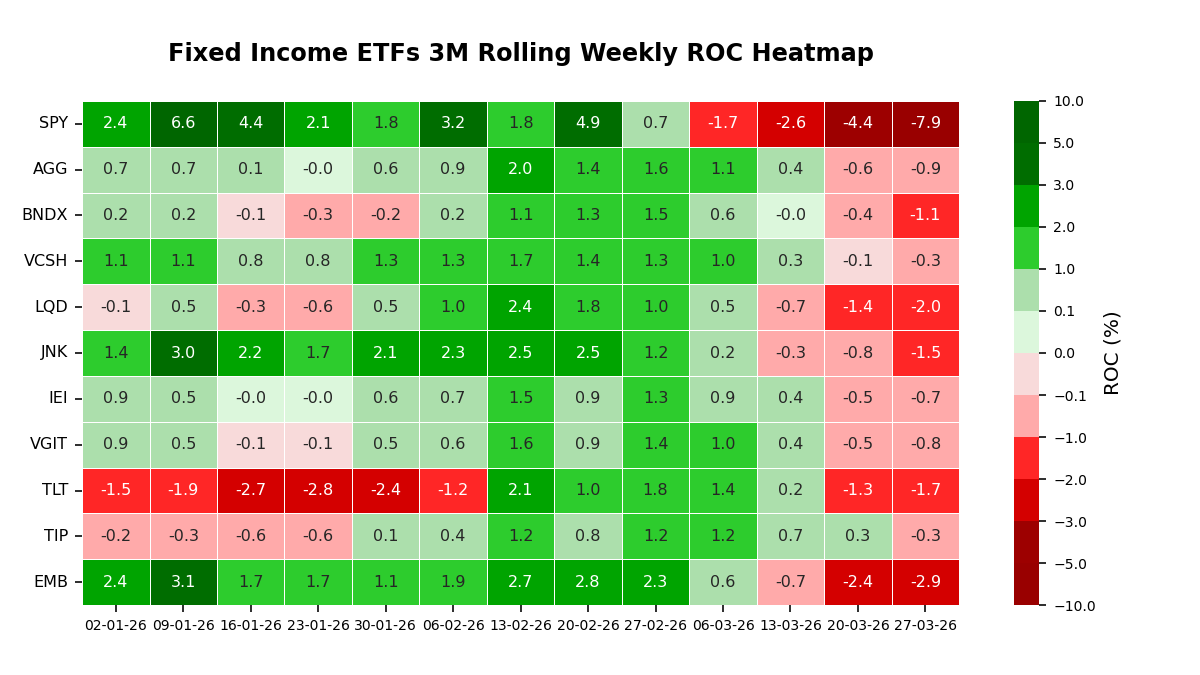
Fixed income momentum is uniformly negative across the ETFs we track, with leadership defined more by “least weak” than outright strength. Relative to the prior week’s baseline, the curve picture looks more synchronized, with duration and credit both cooling rather than trading as a clean split.
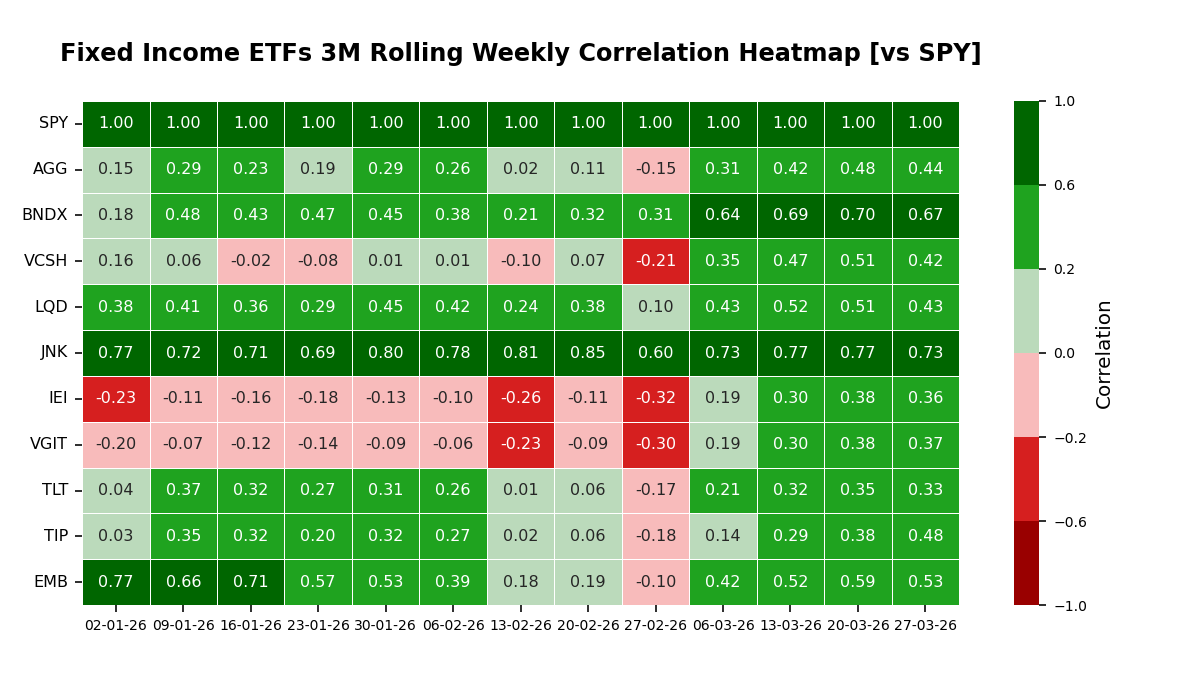
Correlation to the SPY broad equity benchmark remains elevated across most rate-sensitive sleeves versus their one-year norms, keeping the complex more risk-on in its linkage profile than history would suggest. Long-duration Treasuries are the clearest case of that convergence, while high yield remains the most equity-sensitive segment in our set.
This week’s read showed unanimous deterioration in three-month trailing momentum, and TIP flipped negative. The smallest declines in momentum were Vanguard Short-Term Corporate Bond ETF (VCSH) at -0.2 points, iShares 3–7 Year Treasury Bond ETF (IEI) at -0.2, and iShares Core US Aggregate Bond ETF (AGG) at -0.3. The largest declines were Vanguard Total International Bond ETF (BNDX) at -0.7 points, SPDR Bloomberg High Yield Bond ETF (JNK) at -0.7, and iShares TIPS Bond ETF (TIP) at -0.6.
In level terms, VCSH and TIP sit at the front of the pack near -0.3, with IEI and Vanguard Intermediate-Term Treasury ETF (VGIT) in the upper third. AGG and BNDX are mid-pack, while iShares iBoxx $ Investment Grade Corporate Bond ETF (LQD) and iShares JPMorgan USD Emerging Markets Bond (EMB) sit in the lower half, with EMB in the bottom decile.
Statistical stretch is binding across the complex. VCSH screens at a statistical floor with a -2.96 z-score, and BNDX (-2.74), EMB (-2.50), IEI (-2.19) and VGIT (-2.15) are similarly depressed, a setup where normalization pressure can dominate incremental momentum shifts. Several funds are pinned at 12-month troughs, including AGG, BNDX, VCSH, LQD, IEI, VGIT and EMB.
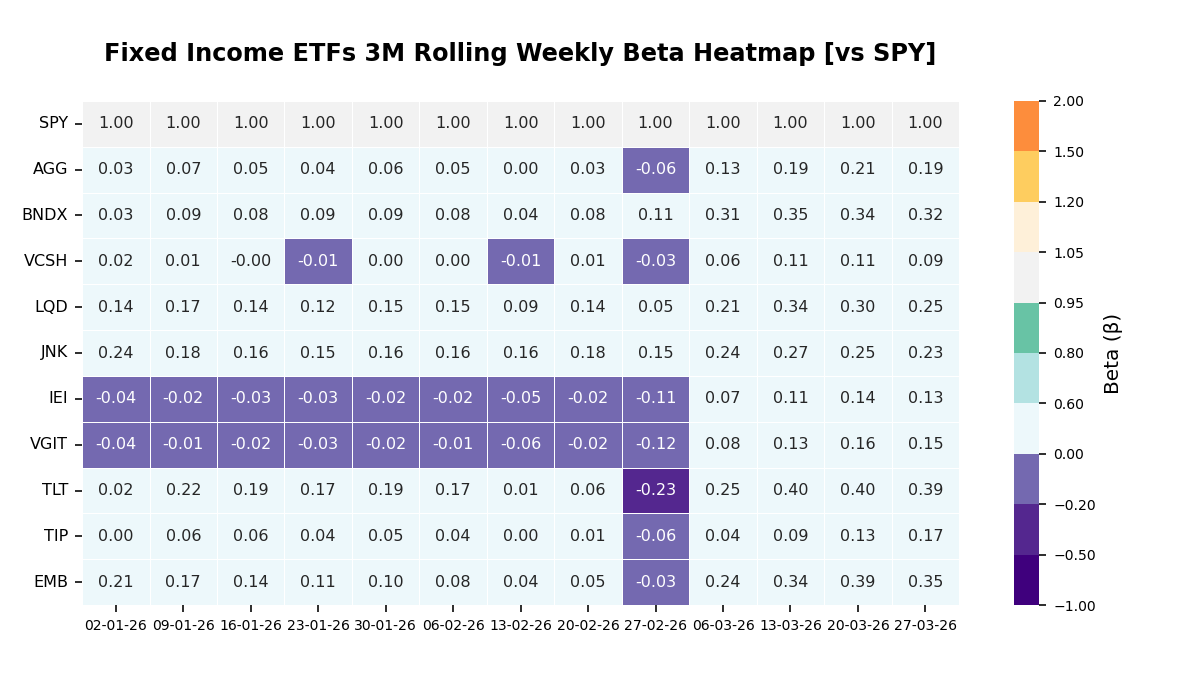
Attribution points to a mix of beta sensitivity and modest idiosyncratic carry. TLT’s correlation to the broad equity benchmark is 0.33 versus a -0.11 one-year mean, alongside 1.4 points of alpha contribution—consistent with stronger upside participation but reduced hedging effectiveness in equity drawdowns. JNK’s correlation is 0.73 versus a 0.74 mean with 0.3 points of alpha, keeping it closer to a beta proxy than a standalone leader.