.png)
Daily Tactical: Equity Leadership Narrows to Tech and Asia
Price participation still far exceeds relative confirmation
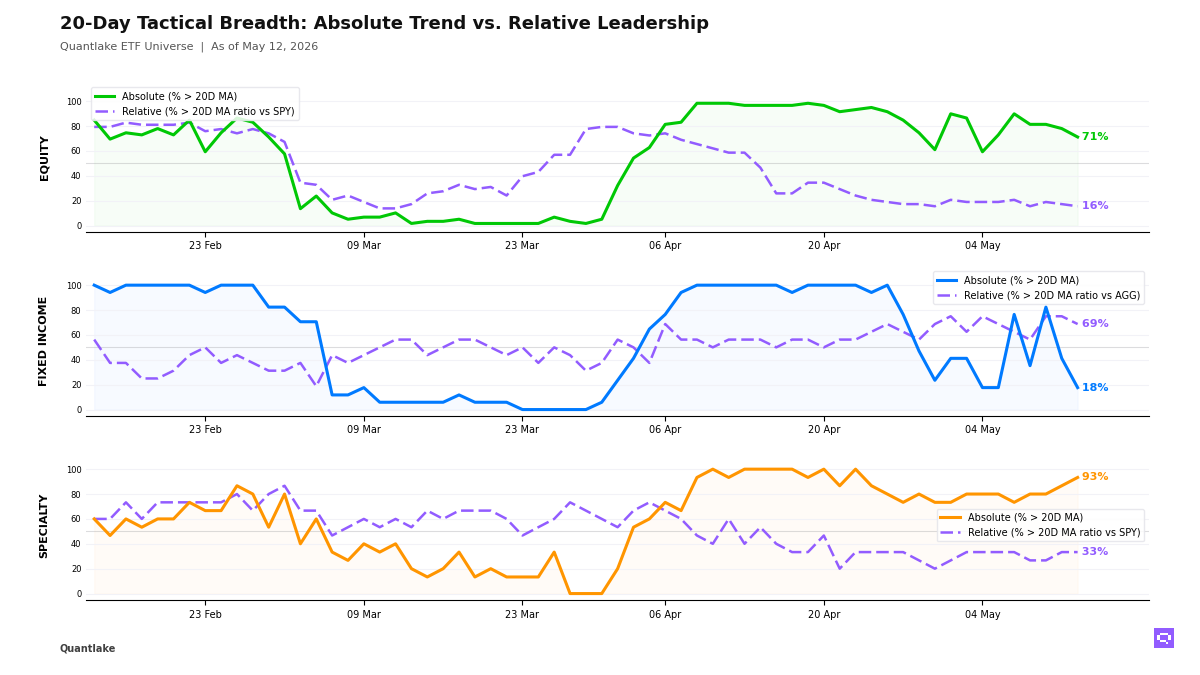
At the close, our equity coverage turned more benchmark-led as price participation slipped while relative confirmation stayed extremely thin. 42 of 59 ETFs (71%, -6.8pp) held above their 20-day moving average, yet only 9 of 58 beat the S&P 500 SPY (16%, -1.7pp), leaving a +56pp gap. Leadership remains in US growth, technology and North Asia, but Europe, small caps, financials and Emg. Markets EEM are losing ground versus the benchmark.
Fixed income is rotating defensively rather than strengthening broadly. Just 3 of 17 ETFs (18%, -23.5pp) held above their 20-day moving average, while 11 of 16 outperformed the Aggregate Bonds AGG (69%, -6.2pp), a -51pp gap that leaves preferreds, TIPS and short duration as the resilient sector while Treasuries, long duration and Mortgage-Backed MBB continue to lag.
Specialty shows stronger price participation than leadership: 14 of 15 ETFs (93%, +6.7pp) stayed above their 20-day moving average, but only 5 of 15 outperformed the S&P 500 SPY (33%, unchanged), for a +60pp gap with semiconductors, momentum, clean energy and digital assets doing the heavy lifting. In commodities, Agriculture Basket DBA crossed above its ratio moving average versus the S&P 500 SPY after a -0.89% 20-day return. We treat that as early stabilization inside a commodity sector where oil, metals and broad baskets remain the stronger relative themes.
20-Day Tactical Breadth
Key Takeaways
• Small-Cap IJR with a +2.54% period return crossed below its 20-day moving average. Consumer Discretionary XLY and S&P SmallCap Value SLYV also fell back below their 20-day moving averages, while Healthcare XLV crossed above its 20-day moving average. The domestic equity tape remains split between defensives and size-sensitive cyclicals.
• Our bond rotation is duration-led, not a broad risk bid. Short Corporate VCSH, Muni Bonds MUB, High Yield Bonds JNK and EM Sovereign Bonds EMB all crossed below their 20-day moving averages, yet those credit-heavy segments still sit on the relative-leader side versus Aggregate Bonds AGG, while Treasuries and Mortgage-Backed MBB remain the weak relative segment.
• Across specialty and commodities, price recovered only partially into leadership. Biotechnology IBB and Min Volatility USMV crossed above their 20-day moving averages, while Ethereum Trust ETHA fell back below its 20-day moving average; DBA's move above its ratio moving average versus the S&P 500 SPY comes with a negative 20-day return, which keeps that commodity signal in the stabilization camp rather than established outperformance.
FEATURED ETF — iShares Core S&P Small-Cap ETF IJR

Other Technical Signal Events
EQUITY
↗ Price breakouts (cross-up 20D MA)
• XLV - Health Care Select Sector · 20D perf: -2.00%
↘ Price breakdowns (cross-down 20D MA)
• IJR - iShares Core S&P Small-Cap ETF · 20D perf: +2.54%
• SLYV - SPDR® S&P 600 Small Cap Value ETF · +1.99%
• XLY - Consumer Discretionary Select Sector · +1.59%
• EWG - iShares MSCI Germany ETF · -0.59%
• VGK - Vanguard FTSE Europe · -1.43%
↗ Leadership gains (cross-up 20D MA vs SPY)
None on the close
↘ Leadership losses (cross-down 20D MA vs SPY)
• EEM - iShares MSCI Emerging Markets ETF · 20D relative perf: -0.51%
FIXED INCOME
↗ Price breakouts (cross-up 20D MA)
None on the close
↘ Price breakdowns (cross-down 20D MA)
• MUB - iShares National Muni Bond ETF · 20D perf: unch.
• JNK - SPDR® Bloomberg High Yield Bond ETF · -0.17%
• VCSH - Vanguard Short-Term Corporate Bond · -0.19%
• EMB - iShares J.P. Morgan USD Emerging Markets Bond ETF · -0.34%
↗ Leadership gains (cross-up 20D MA vs AGG)
None on the close
↘ Leadership losses (cross-down 20D MA vs AGG)
• MBB - iShares MBS ETF · 20D relative perf: -0.13%
SPECIALTY
↗ Price breakouts (cross-up 20D MA)
• IBB - iShares Biotechnology ETF · 20D perf: -2.03%
• USMV - iShares MSCI USA Min Vol Factor ETF · +0.88%
↘ Price breakdowns (cross-down 20D MA)
• ETHA - iShares Ethereum Trust ETF · 20D perf: -1.43%
↗ Leadership gains (cross-up 20D MA vs SPY)
None on the close
↘ Leadership losses (cross-down 20D MA vs SPY)
None on the close
COMMODITIES
↗ Price breakouts (cross-up 20D MA)
None on the close
↘ Price breakdowns (cross-down 20D MA)
None on the close
↗ Leadership gains (cross-up 20D MA vs SPY)
• DBA - Invesco DB Agriculture · 20D relative perf: -0.89%
↘ Leadership losses (cross-down 20D MA vs SPY)
None on the close
Romain Gandon
CEO, Quantlake
Disclaimer: This article is for informational and educational purposes only and does not constitute investment advice. Past performance is not indicative of future results.