.png)
Daily Tactical: Fixed Income Rotates Away From Duration
We see bond prices break while equity leadership stays narrow
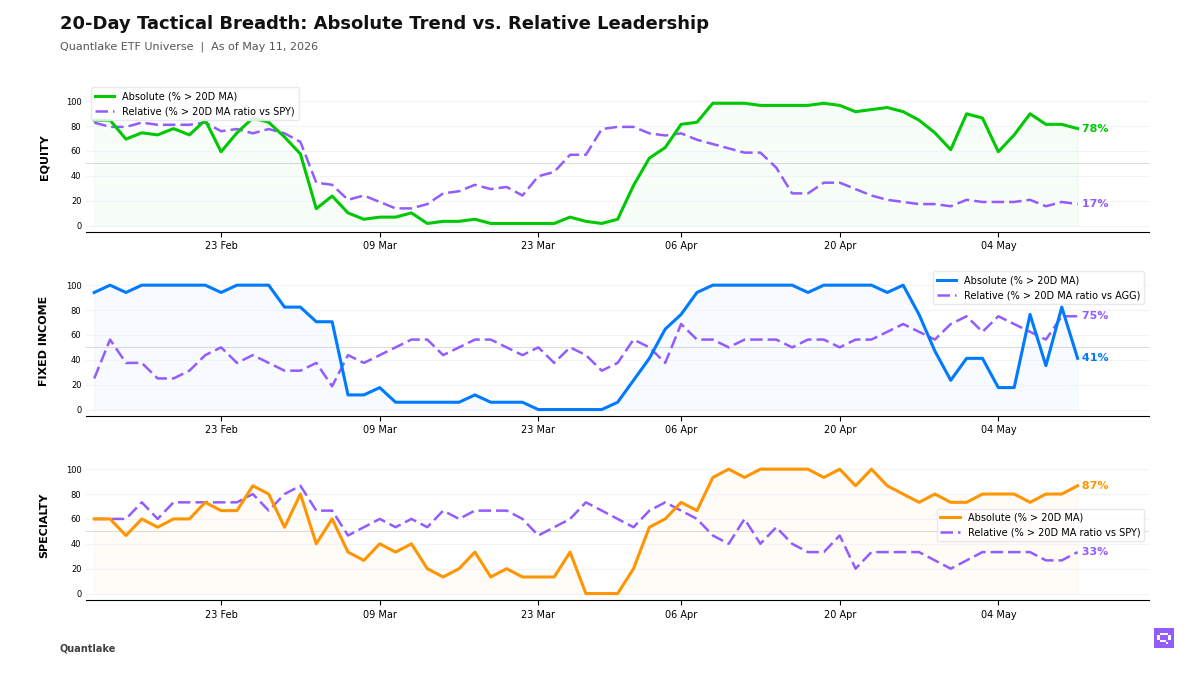
The clearest shift at the close came from bonds in our universe. Price participation broke lower even as relative leadership held up. Only 7 of 17 ETFs (41%, -41.2pp) held above their 20-day moving average, down from 82% on the prior session, while 12 of 16 ETFs (75%, unchanged on the day) still outperformed their benchmark, leaving a -34pp gap. The split sits in rate-sensitive government and long-duration Treasuries rolling over, with Long Treasuries TLT below its 20-day moving average, while short-duration, EM debt and parts of credit remain the surviving relative leaders.
Equities remain benchmark-led rather than broadly confirmed. 46 of 59 ETFs (78%, -3.4pp) held above their 20-day moving average, but only 10 of 58 ETFs (17%, -1.7pp) beat their benchmark at the close, a +61pp gap. Leadership stays concentrated in US growth and Asia-Pacific equity, while developed ex-US, quality, value and dividend names sit above their moving averages without relative sponsorship. Communication Services XLC and India INDA were among the fresh price breaks lower.
Specialty participation improved in price but not enough to change the character of the move. 13 of 15 ETFs (87%, +6.7pp) stood above their 20-day moving average and relative breadth also rose to 5 of 15 ETFs (33%, +6.7pp), yet the +53pp gap still points to semiconductors, momentum, clean energy and crypto doing the heavy lifting while real estate and defensive equity overlays fail to confirm. In commodities, Oil USO reclaimed its 20-day moving average and crossed above its ratio moving average versus SPY, while Broad Commodities PDBC also crossed above its 20-day ratio moving average versus SPY.
20-Day Tactical Breadth
Key Takeaways
• Within fixed income, High Yield HYG, Investment Grade Credit LQD, Corporate Credit VCIT, Mortgage-Backed MBB and Global Bonds BNDX crossed below their 20-day moving averages even as their ratios held in relative leadership. We read that as defensive outperformance inside bonds, while duration remains the clear weak spot and short-duration strength reflects stability rather than risk appetite.
• In equities, Russell Growth IWF crossed below its 20-day ratio moving average versus SPY after a +1.35% 20-day relative return, marking fading leadership rather than outright relative breakdown. Materials XLB and Energy XLE also crossed above their 20-day moving averages as the tape rotated toward more cyclical price leadership while low-volatility and dividend-heavy names lost ground.
• Gold Miners GDX, with a -8.30% period relative return versus SPY, crossed above its 20-day ratio moving average. We pair that with harder-asset leadership across oil, copper, silver and broad commodities, while agriculture remains the laggard across timeframes.
FEATURED ETF — VanEck Gold Miners ETF GDX vs SPY

Other Technical Signal Events
EQUITY
↗ Price breakouts (cross-up 20D MA)
• XLE - Energy Select Sector · 20D perf: +0.11%
• XLB - Materials Select Sector · +0.13%
↘ Price breakdowns (cross-down 20D MA)
• MDYV - SPDR® S&P 400 Mid Cap Value ETF · 20D perf: +1.33%
• XLC - Communication Services Select Sector · +0.66%
• ACWV - iShares MSCI Global Min Vol Factor ETF · unch.
• INDA - iShares MSCI India ETF · -1.88%
↗ Leadership gains (cross-up 20D MA vs SPY)
None on the close
↘ Leadership losses (cross-down 20D MA vs SPY)
• IWF - iShares Russell 1000 Growth ETF · 20D relative perf: +1.35%
FIXED INCOME
↗ Price breakouts (cross-up 20D MA)
None on the close
↘ Price breakdowns (cross-down 20D MA)
• HYG - iShares iBoxx $ High Yield Corporate Bond ETF · 20D perf: +0.17%
• BNDX - Vanguard Total International Bond · +0.11%
• VCIT - Vanguard Intermediate-Term Corporate Bond · -0.20%
• MBB - iShares MBS ETF · -0.20%
• LQD - iShares iBoxx $ Investment Grade Corporate Bond ETF · -0.24%
• TLT - iShares 20+ Year Treasury Bond ETF · -1.01%
↗ Leadership gains (cross-up 20D MA vs AGG)
None on the close
↘ Leadership losses (cross-down 20D MA vs AGG)
None on the close
SPECIALTY
↗ Price breakouts (cross-up 20D MA)
• ETHA - iShares Ethereum Trust ETF · 20D perf: +3.45%
↘ Price breakdowns (cross-down 20D MA)
None on the close
↗ Leadership gains (cross-up 20D MA vs SPY)
• GDX - VanEck Gold Miners ETF · 20D relative perf: -8.30%
↘ Leadership losses (cross-down 20D MA vs SPY)
None on the close
COMMODITIES
↗ Price breakouts (cross-up 20D MA)
• USO - United States Oil Fund LP · 20D perf: +7.93%
↘ Price breakdowns (cross-down 20D MA)
None on the close
↗ Leadership gains (cross-up 20D MA vs SPY)
• PDBC - Invesco Optimum Yield Diversified Commodity Strategy No K-1 ETF · 20D relative perf: -0.32%
• USO - United States Oil Fund LP · +0.17%
↘ Leadership losses (cross-down 20D MA vs SPY)
None on the close
Romain Gandon
CEO, Quantlake
Disclaimer: This article is for informational and educational purposes only and does not constitute investment advice. Past performance is not indicative of future results.