.png)
Daily Tactical: Tech Carries as Equity Breadth Cracks
Breadth broke lower while bonds favored shorter duration
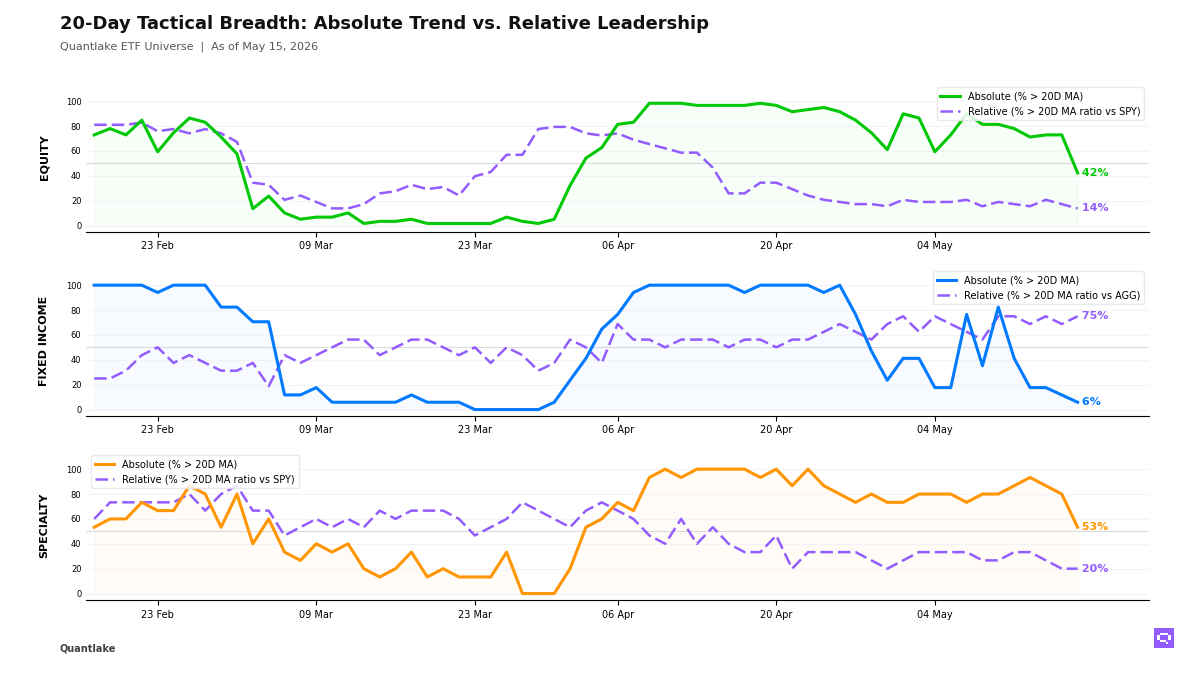
Leadership narrowed decisively into the close as equity participation broke down across our ETF universe. Only 25 of 59 ETFs (42%, -30.5pp) held above their 20-day moving average, while just 8 of 58 ETFs (14%, -3.5pp) outperformed the S&P 500 SPY, leaving a +29pp gap. Leadership is concentrated in US growth, technology and energy through Nasdaq 100 QQQ and Energy XLE, while small caps, equal weight, developed ex-US and China lost ground, and parts of emerging markets and Asia now look more like price recovery than true leadership.
Fixed income remained defensive, not constructive. Just 1 of 17 ETFs (6%, -5.9pp) stayed above their 20-day moving average, yet 12 of 16 ETFs (75%, +6.2pp) still outperformed the Aggregate Bonds AGG, a -69pp gap that points to relative resilience in short duration, intermediate Treasuries, investment grade, munis and high yield while long duration and EM debt remain the weak spots. That is a stability bid, not a broad risk-on message.
Specialty participation weakened as well, with 8 of 15 ETFs (53%, -26.7pp) still above their 20-day moving average. Semiconductors and momentum remained the only clear themes beating the S&P 500 SPY, while precious metals, biotech, real estate and infrastructure lost ground. Commodities split rather than weakening uniformly: Broad Commodities PDBC improved versus the S&P 500 SPY, while silver, agriculture and copper-linked exposure rolled over, leaving confirmation thin beyond the growth-led equity core.
20-Day Tactical Breadth
Key Takeaways
• Across daily, weekly and monthly readings, US growth and technology still form the core equity leadership cluster versus the S&P 500 SPY, with South Korea also holding up. Low volatility, developed ex-US equity, Europe, China and broad cyclical US sectors remain the persistent lagging themes. Leadership has narrowed sharply.
• 3-7yr Treasuries IEI crossed above its ratio moving average versus Aggregate Bonds AGG, while Int. Treasuries VGIT also moved back above its ratio moving average after a flat 20-day return. We treat that as a duration rotation into stability rather than fresh bond strength, especially with long-duration Treasuries and EM Sovereign Bonds EMB still lagging the benchmark.
• Gold Miners GDX with a -12.95% period return crossed below its 20-day moving average. That lands alongside Silver SLV losing both price and relative ground, even as Broad Commodities PDBC crossed above its ratio moving average versus the S&P 500 SPY after a 6.17% 20-day return.
FEATURED ETF — VanEck Gold Miners ETF GDX

Other Technical Signal Events
EQUITY
↗ Price breakouts (cross-up 20D MA)
None on the close
↘ Price breakdowns (cross-down 20D MA)
• IWM - iShares Russell 2000 ETF · 20D perf: +0.66%
• MDYG - SPDR® S&P 400 Mid Cap Growth ETF · +0.43%
• VO - Vanguard Mid-Cap · -0.31%
• RSP - Invesco S&P 500® Equal Weight ETF · -0.79%
• SLYG - SPDR® S&P 600 Small Cap Growth ETF · -0.86%
• VB - Vanguard Small-Cap · -1.00%
• XLI - Industrial Select Sector · -1.22%
• VWO - Vanguard FTSE Emerging Markets · -1.25%
• ACWV - iShares MSCI Global Min Vol Factor ETF · -1.34%
• IMTM - iShares MSCI Intl Momentum Factor ETF · -1.87%
• XLV - Health Care Select Sector · -2.49%
• EFA - iShares MSCI EAFE ETF · -2.49%
• XLC - Communication Services Select Sector · -2.54%
• IQLT - iShares MSCI Intl Quality Factor ETF · -2.68%
• VGK - Vanguard FTSE Europe · -3.68%
• FXI - iShares China Large-Cap ETF · -3.72%
• MCHI - iShares MSCI China ETF · -4.47%
• COPX - Global X Copper Miners ETF · -4.75%
↗ Leadership gains (cross-up 20D MA vs SPY)
• XLE - Energy Select Sector · 20D relative perf: +3.79%
↘ Leadership losses (cross-down 20D MA vs SPY)
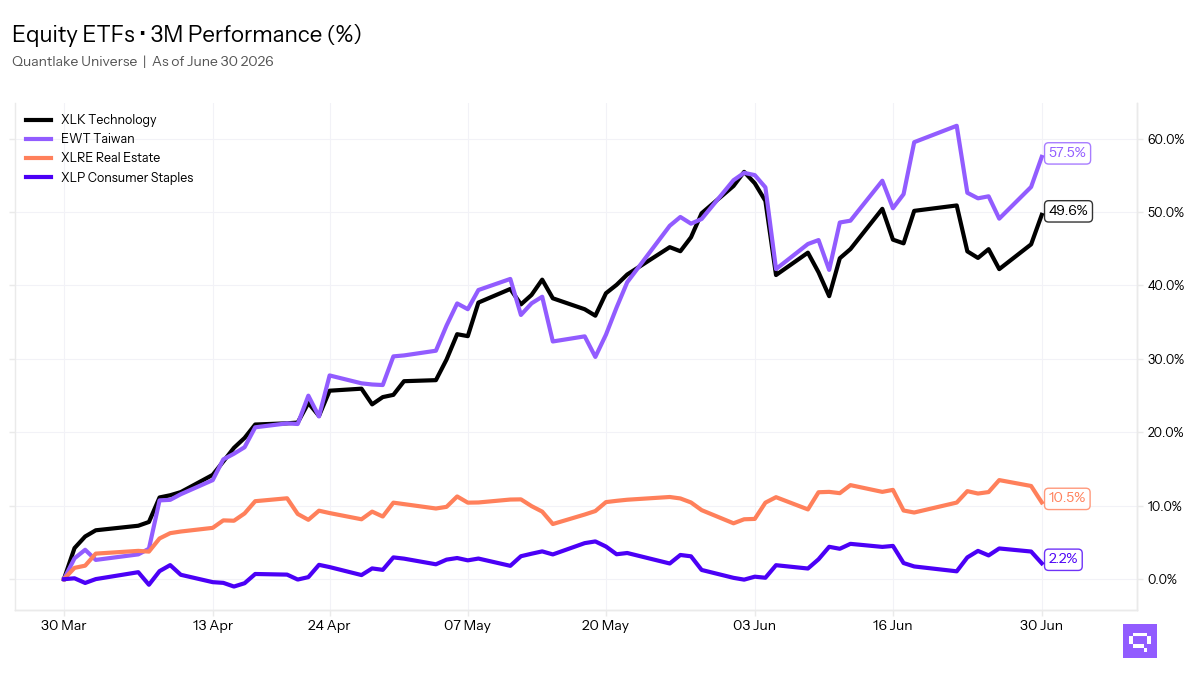
• EWT - iShares MSCI Taiwan ETF · 20D relative perf: +5.38%
• EEM - iShares MSCI Emerging Markets ETF · -1.77%
• COPX - Global X Copper Miners ETF · -8.49%
FIXED INCOME
↗ Price breakouts (cross-up 20D MA)
None on the close
↘ Price breakdowns (cross-down 20D MA)
• PFF - iShares Preferred and Income Securities ETF · 20D perf: -0.29%
↗ Leadership gains (cross-up 20D MA vs AGG)
• VGIT - Vanguard Intermediate-Term Treasury · 20D relative perf: unch.
• IEI - iShares 3-7 Year Treasury Bond ETF · unch.
↘ Leadership losses (cross-down 20D MA vs AGG)
• EMB - iShares J.P. Morgan USD Emerging Markets Bond ETF · 20D relative perf: -0.10%
SPECIALTY
↗ Price breakouts (cross-up 20D MA)
None on the close
↘ Price breakdowns (cross-down 20D MA)
• PAVE - Global X U.S. Infrastructure Development ETF · 20D perf: +0.64%
• REET - iShares Global REIT ETF · -2.26%
• IBB - iShares Biotechnology ETF · -5.56%
• GDX - VanEck Gold Miners ETF · -12.95%
↗ Leadership gains (cross-up 20D MA vs SPY)
None on the close
↘ Leadership losses (cross-down 20D MA vs SPY)
None on the close
COMMODITIES
↗ Price breakouts (cross-up 20D MA)
None on the close
↘ Price breakdowns (cross-down 20D MA)
• DBA - Invesco DB Agriculture · 20D perf: +3.38%
• SLV - iShares Silver · -6.23%
↗ Leadership gains (cross-up 20D MA vs SPY)
• PDBC - Invesco Optimum Yield Diversified Commodity Strategy No K-1 ETF · 20D relative perf: +6.17%
↘ Leadership losses (cross-down 20D MA vs SPY)
• CPER - United States Copper LP · 20D relative perf: -1.74%
• SLV - iShares Silver · -9.92%
Romain Gandon
CEO, Quantlake
Disclaimer: This article is for informational and educational purposes only and does not constitute investment advice. Past performance is not indicative of future results.