.png)
Daily Tactical Participation Cracks Beyond Growth
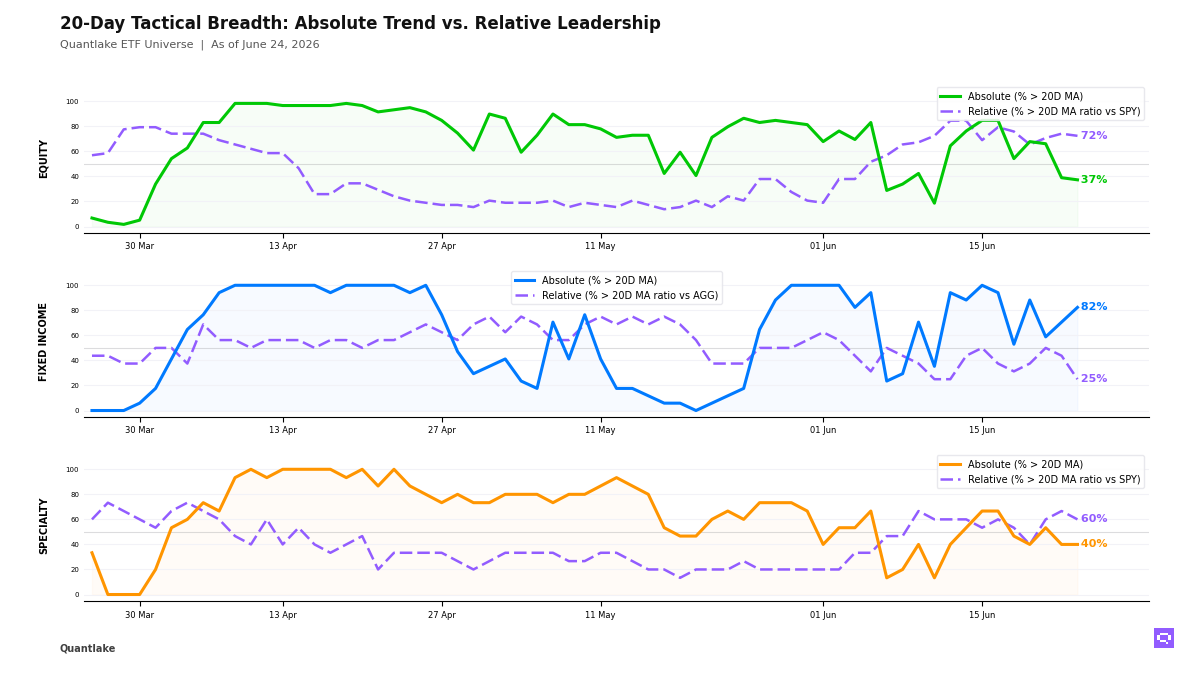
At the close, we saw equity participation crack across our ETF universe even as relative leadership stayed trapped in a narrow pocket of US growth and Asia. Just 35 of 59 equity ETFs (59%, -27.1pp on the day) held above their 20-day moving average, down from 86%, while relative breadth held at 11 of 58 (19%, unchanged), leaving a +40pp price/relative gap; developed ex-US, Europe, China, financials and industrials rolled over, while US growth, Taiwan and South Korea still carried the relative tape. Energy XLE also saw its ratio versus SPY cross above its 20-day moving average, but its -8.7% 20-day return keeps that move in the stabilization camp rather than clean leadership.
We also saw fixed income turn more defensive by end of day. Only 3 of 17 bond ETFs (18%, -17.6pp on the day) held above their 20-day moving average, yet relative breadth improved to 12 of 16 (75%, +12.5pp), a -57pp gap that points to active rotation inside a falling price backdrop: high yield and EM debt slipped below their moving averages, while Corp. Credit VCIT and Int. Treasuries VGIT improved versus AGG and long duration remained the weak flank on rate sensitivity.
Beyond those core buckets, we still see specialty holding up in price more than in leadership, and commodities only partly confirm that tone. 12 of 15 specialty ETFs (80%, unchanged on the day) held above their 20-day moving average, but only 5 of 15 (33%, unchanged on the day) outperformed, with Ethereum Trust ETHA improving against SPY while Infrastructure PAVE faded; in commodities, Agriculture Basket DBA crossed above its ratio 20-day moving average versus SPY even though its 20-day relative return is still -4.8%, and broader commodity leadership sits more cleanly in oil and diversified commodity exposure than in precious metals.
20-Day Tactical Breadth

Key Takeaways
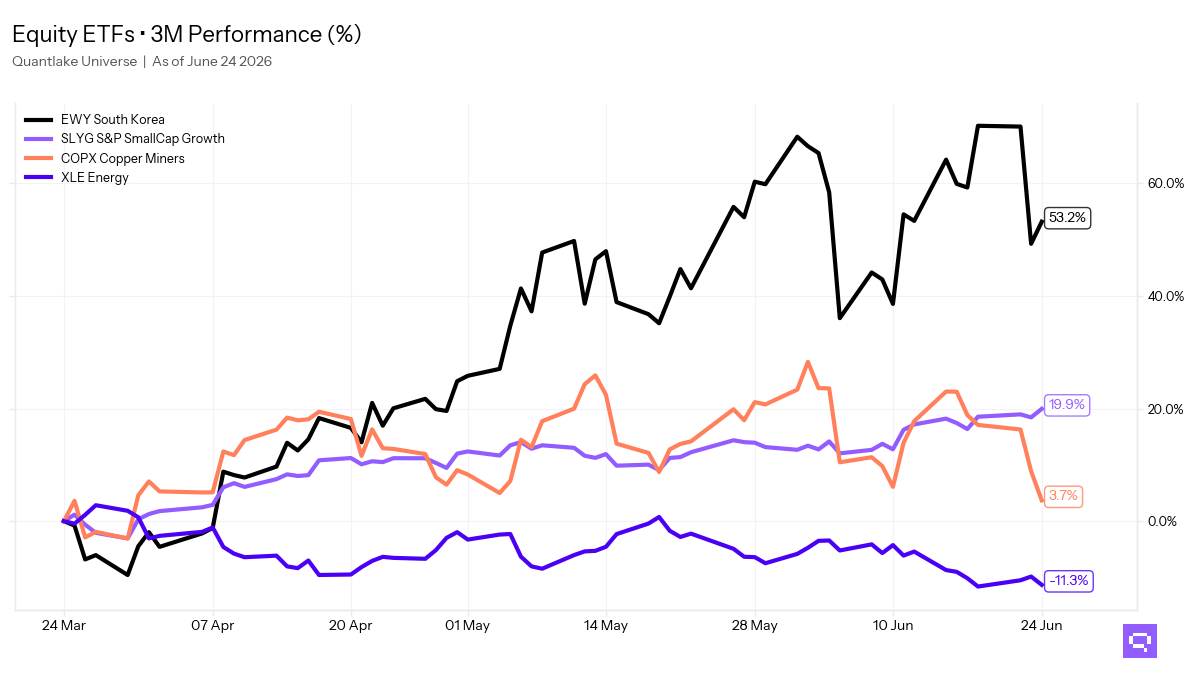
• Across timescales, we still find relative confirmation in emerging markets (EEM), Taiwan equity (EWT), South Korea equity (EWY), US equity (IWM, IYW, QQQ, SPYG), value factor (VLUE), and Technology sector (XLK). That leaves low-volatility, developed ex-US, China, Europe, and several US defensive and cyclical sleeves as multi-horizon laggards, so the equity unwind is hitting old leaders and weak breadth pockets very unevenly.
• Within bonds, we read the leadership split as duration first, credit second. Relative winners still include EM Debt (EMB), high-yield credit (HYG, JNK), Muni Broad (MUB), Preferred (PFF), inflation-linked (TIP), Investment Grade (VCIT), and short-duration (VCSH, VTIP), while government/treasury (IEF) and long-duration (TLT) lag; short-duration strength is stability, and the clearest weakness remains rate-sensitive duration rather than a broad credit break.
• In specialty and commodities, we would separate true relative winners from early repairs. Clean energy (ICLN), momentum factor (MTUM), and semiconductors (SMH) carry the stronger specialty leadership profile, while gold, gold miners, real estate, and low-volatility overlays are mostly price recoveries without relative confirmation; the cleaner commodity leadership remains with diversified commodities and oil via PDBC and USO, while DBA and XLE are only stabilizing on a ratio basis.
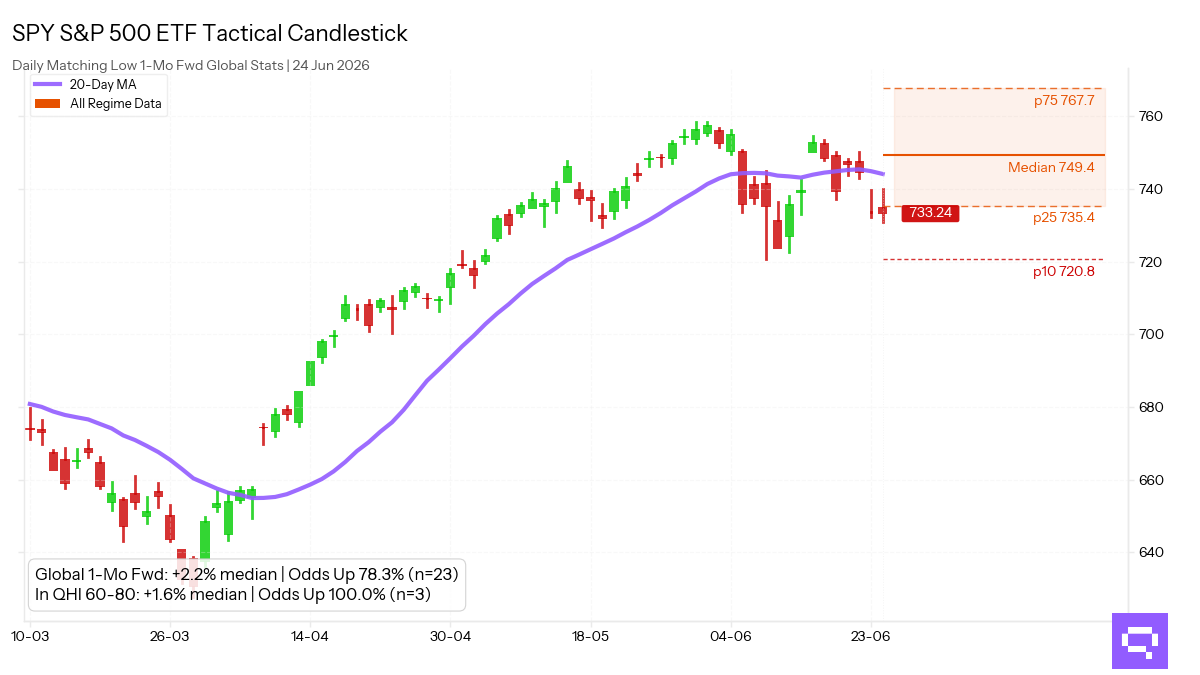
FEATURED ETF — Energy Select Sector XLE vs SPY

Other Technical Signal Events
EQUITY
↗ Price breakouts (cross-up 20D MA)
None on the close
↘ Price breakdowns (cross-down 20D MA)
• VEA - Vanguard FTSE Developed Markets · 20D perf: +4.28%
• XLC - Communication Services Select Sector · +3.88%
• XLI - Industrial Select Sector · +3.87%
• IMTM - iShares MSCI Intl Momentum Factor ETF · +3.85%
• XLF - Financial Select Sector · +3.41%
• EWG - iShares MSCI Germany ETF · +3.16%
• EWJ - iShares MSCI Japan ETF · +2.98%
• FXI - iShares China Large-Cap ETF · +2.81%
• MCHI - iShares MSCI China ETF · +2.63%
• IQLT - iShares MSCI Intl Quality Factor ETF · +2.58%
• EFA - iShares MSCI EAFE ETF · +2.24%
• VGK - Vanguard FTSE Europe · +2.06%
• IVLU - iShares Edge MSCI Intl Value Factor ETF · +1.59%
• IDV - iShares International Select Dividend ETF · +1.47%
• SDY - SPDR® S&P Dividend ETF · +0.81%
• ACWV - iShares MSCI Global Min Vol Factor ETF · unch.
↗ Leadership gains (cross-up 20D MA vs SPY)
• XLE - Energy Select Sector · 20D relative perf: -8.67%
↘ Leadership losses (cross-down 20D MA vs SPY)
• SLYG - SPDR® S&P 600 Small Cap Growth ETF · 20D relative perf: unch.
FIXED INCOME
↗ Price breakouts (cross-up 20D MA)
None on the close
↘ Price breakdowns (cross-down 20D MA)
• EMB - iShares J.P. Morgan USD Emerging Markets Bond ETF · 20D perf: +1.65%
• JNK - SPDR® Bloomberg High Yield Bond ETF · +0.75%
• HYG - iShares iBoxx $ High Yield Corporate Bond ETF · +0.65%
↗ Leadership gains (cross-up 20D MA vs AGG)
• VGIT - Vanguard Intermediate-Term Treasury · 20D relative perf: unch.
• VCIT - Vanguard Intermediate-Term Corporate Bond · +0.25%
↘ Leadership losses (cross-down 20D MA vs AGG)
None on the close
SPECIALTY
↗ Price breakouts (cross-up 20D MA)
None on the close
↘ Price breakdowns (cross-down 20D MA)
None on the close
↗ Leadership gains (cross-up 20D MA vs SPY)
• ETHA - iShares Ethereum Trust ETF · 20D relative perf: +0.67%
↘ Leadership losses (cross-down 20D MA vs SPY)
• PAVE - Global X U.S. Infrastructure Development ETF · 20D relative perf: +0.27%
COMMODITIES
↗ Price breakouts (cross-up 20D MA)
None on the close
↘ Price breakdowns (cross-down 20D MA)
None on the close
↗ Leadership gains (cross-up 20D MA vs SPY)
• DBA - Invesco DB Agriculture · 20D relative perf: -4.83%
↘ Leadership losses (cross-down 20D MA vs SPY)
None on the close
Romain Gandon
CEO, Quantlake
Disclaimer: This article is for informational and educational purposes only and does not constitute investment advice. Past performance is not indicative of future results.