.png)
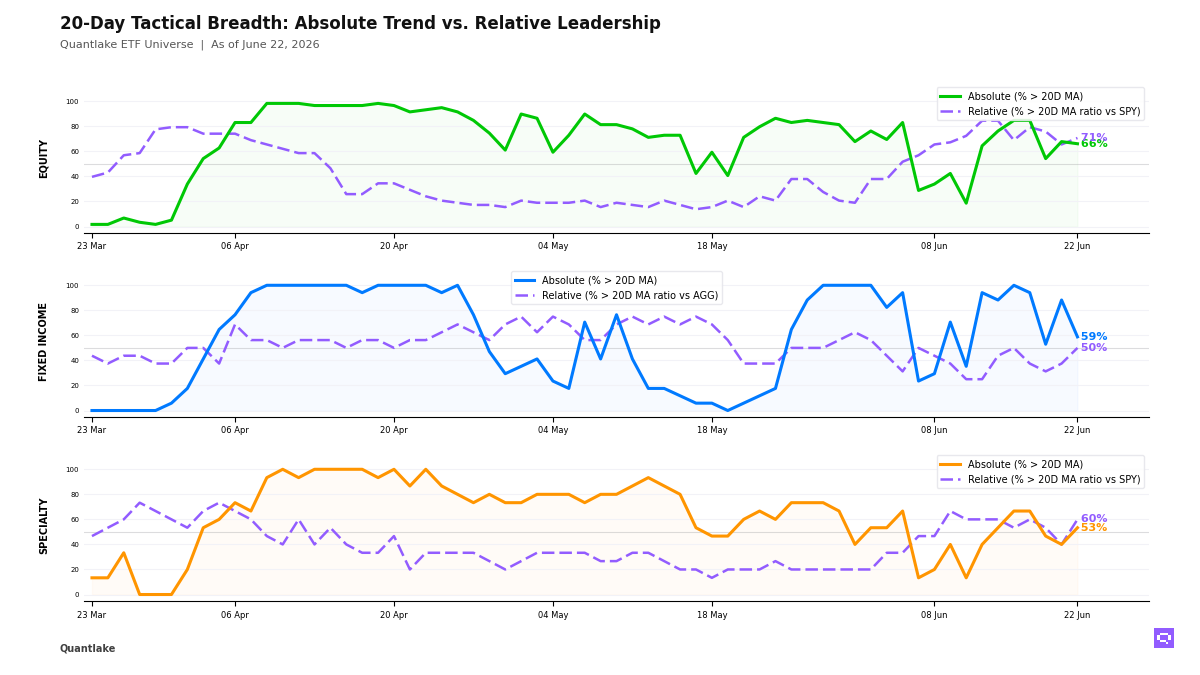
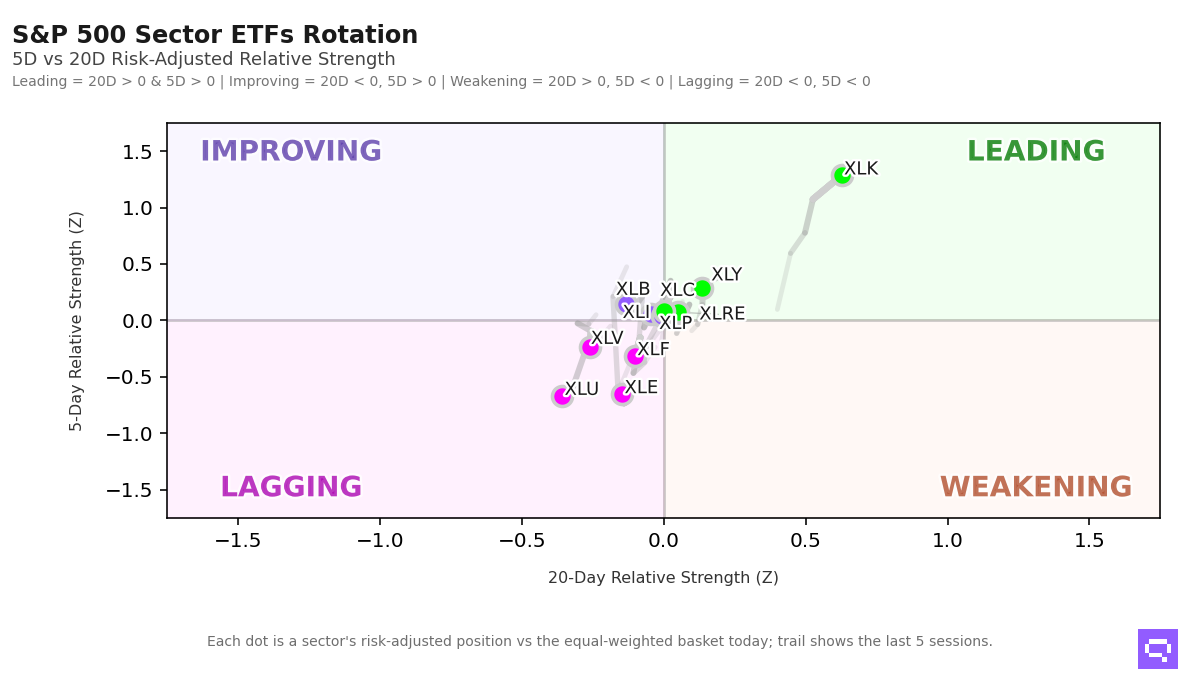
S&P 500 Sector Rotation — Where Leadership Stands
Normal-dispersion rotation with Technology as the clear leading outlier.
US equity sector dispersion across the 11 S&P 500 sector ETFs remains in a normal rotation regime, with breadth neither compressed nor extreme. The backdrop points to a standard cross-sectional market rather than a disorderly or highly directional leadership phase, though the spread between the strongest and weakest groups remains meaningful.
Technology stands apart. XLK is the only sector with convincingly strong 5-day relative strength and top-tier 20-day relative strength, and recent velocity continues to accelerate. That reinforces its status as the market’s confirmed leader, not just a short-term outperformer.
Elsewhere, rotation remains tentative. Materials is the clearest improving area, with 5-day relative strength turning positive while 20-day relative strength remains slightly negative, suggesting recovery is underway but not yet fully established. Consumer Discretionary, Real Estate, and Communication Services are also positive on both horizons, though they remain secondary leaders given their proximity to the center of the distribution.
Across the broader tape, Industrials, Consumer Staples, and Materials are improving, while Financials, Health Care, Energy, and Utilities continue to lag on both 5-day and 20-day relative strength.
Sector Rotation Map
Alpha Z: risk-adjusted relative strength vs the equal-weighted S&P 500 sector basket (Z-score). Velocity: rate of change in short-term relative strength (1D vs 5D Z-score delta — tactical momentum). Structural velocity: smoothed 5D vs 20D momentum delta, reflecting regime-level directional shifts.
Momentum Leaders
• Technology — Rank #1 | Alpha Z: +2.47 | Velocity: +1.18
• Consumer Discretionary — Rank #4 | Alpha Z: +0.20 | Velocity: -0.09
• Real Estate — Rank #5 | Alpha Z: -0.04 | Velocity: -0.12
• Communication Services — Rank #8 | Alpha Z: -0.52 | Velocity: -0.60
Rotation Warnings
• Financial — Rank shift (1D vs 5D): -1 | Structural velocity: -0.21
Mean Reversion Candidates
• Consumer Staples — Alpha Z: +0.22 | Velocity: +0.18
• Materials — Alpha Z: +0.32 | Velocity: +0.17
• Energy — Alpha Z: -0.31 | Velocity: +0.34
Romain Gandon
CEO, Quantlake
Disclaimer: This article is for informational and educational purposes only and does not constitute investment advice. Past performance is not indicative of future results.