.png)
Daily Tactical Leadership Narrows Beyond Tech
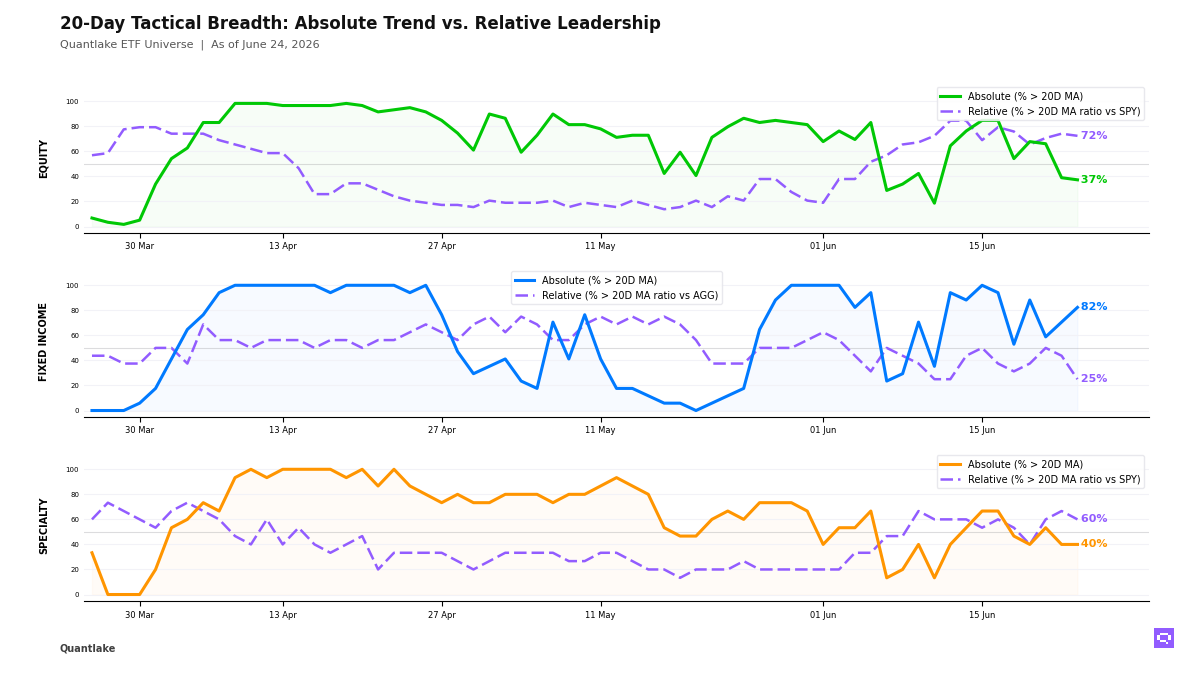
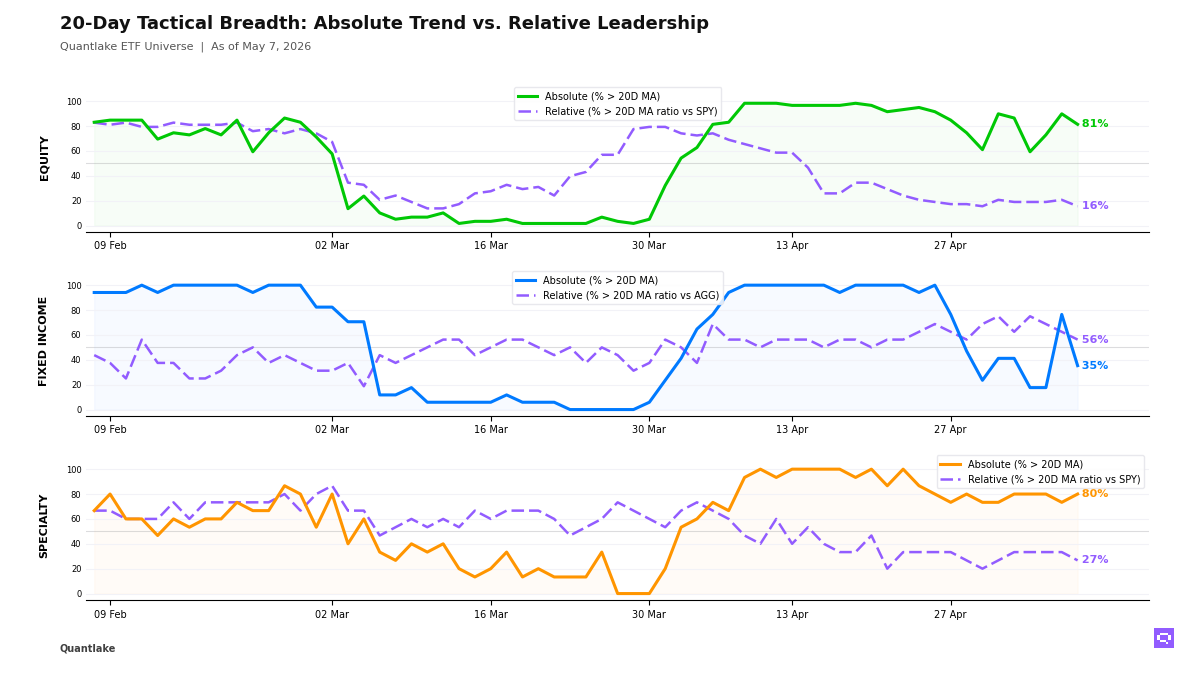
Price participation held up, but relative leadership kept slipping
At the close, our equity universe stayed benchmark-led as price participation held up far better than leadership. 48 of 59 ETFs (81%, -8.5pp on the day) held above their 20-day moving average, but only 9 of 58 (16%, -5.2pp on the day) were outperforming their benchmark, leaving a +66pp gap; leadership stayed concentrated in US growth and technology plus Taiwan, South Korea and emerging markets, while dividend, low-volatility, developed ex-US and smaller-cap exposures lost ground. Relative breaks in Russell 2000 IWM, S&P MidCap Growth MDYG and Emg. Markets VWO reinforced that narrowing.
By end of day, fixed income had shifted into a rotation-in-bear profile rather than a uniform credit break. Just 6 of 17 ETFs (35%, -41.2pp on the day) held above their 20-day moving average, while 9 of 16 (56%, -6.2pp on the day) still outperformed AGG, a -21pp gap that kept EM debt, munis, preferreds, inflation-linked bonds and short-duration credit on the relative leader list while Treasuries, mortgages and longer-duration investment-grade credit weakened. High Yield HYG, High Yield Bonds JNK and Short Corporate VCSH all sat in the price-below, relative-outperforming camp, which points to defensive stability and rate sensitivity more than broad risk appetite.
Specialty also stayed benchmark-led, with 12 of 15 ETFs (80%, +6.7pp on the day) above their 20-day moving average versus just 4 of 15 (27%, -6.7pp) outperforming SPY, a +53pp gap that left relative leadership concentrated in Semiconductors SMH, clean energy and momentum while infrastructure, real estate, low-volatility equity and several alternative sleeves failed to confirm. In commodities, Gold GLD crossed above its 20-day moving average, while Silver SLV crossed above its 20-day ratio moving average versus SPY despite a still-negative 20-day relative return, leaving that move closer to early stabilization than established leadership.
20-Day Tactical Breadth
Key Takeaways
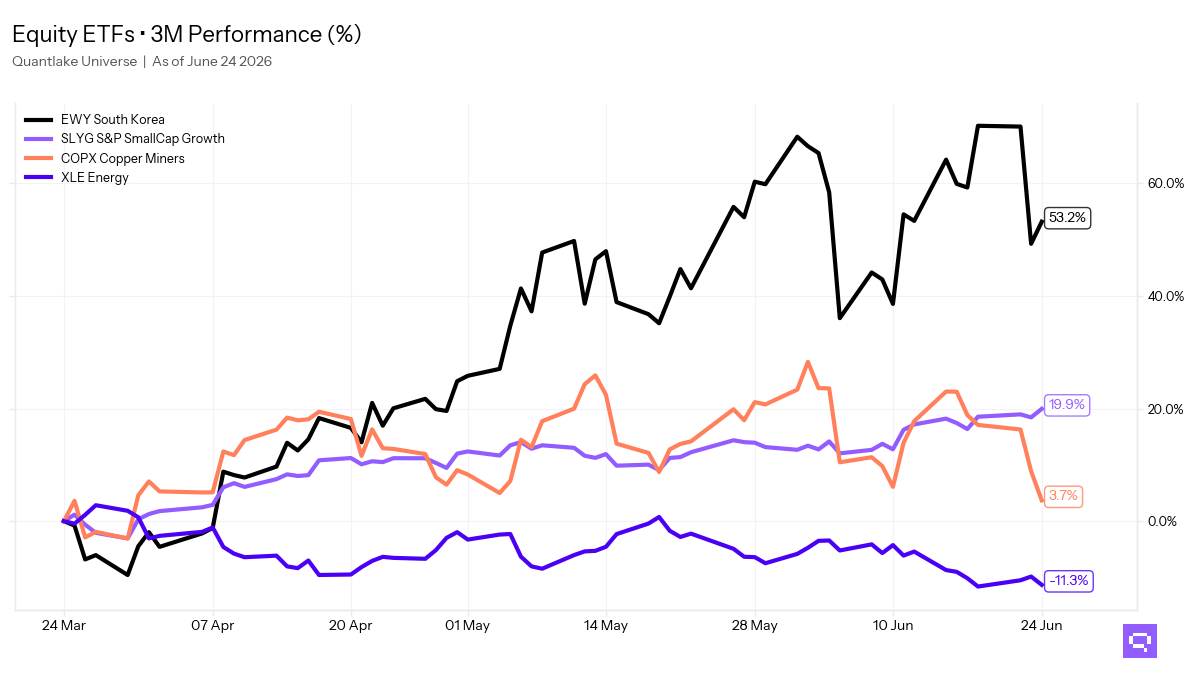
• Across timescales, we still see relative leadership concentrated in emerging markets, Taiwan, South Korea and US growth/technology [emerging markets (EEM) | Taiwan equity (EWT) | South Korea equity (EWY) | US equity (IYW, QQQ, SPYG) | value factor (VLUE) | Technology sector (XLK)]. The opposing side is far broader, with low-volatility, dividend, developed ex-US, real estate, utilities, healthcare and financials still sitting in the cross-timescale laggard camp.
• Within fixed income, we read the split as a duration and rate-sensitivity rotation more than a blanket credit unwind. The simultaneous relative leaders are EM Debt (EMB) | high-yield credit (HYG, JNK) | Muni Broad (MUB) | Preferred (PFF) | inflation-linked (TIP) | short-duration (VCSH, VTIP), while government/treasury (IEF, IEI, VGIT) | long-duration (TLT) remain on the lagging side; short-duration strength here signals stability, not outright risk-seeking.
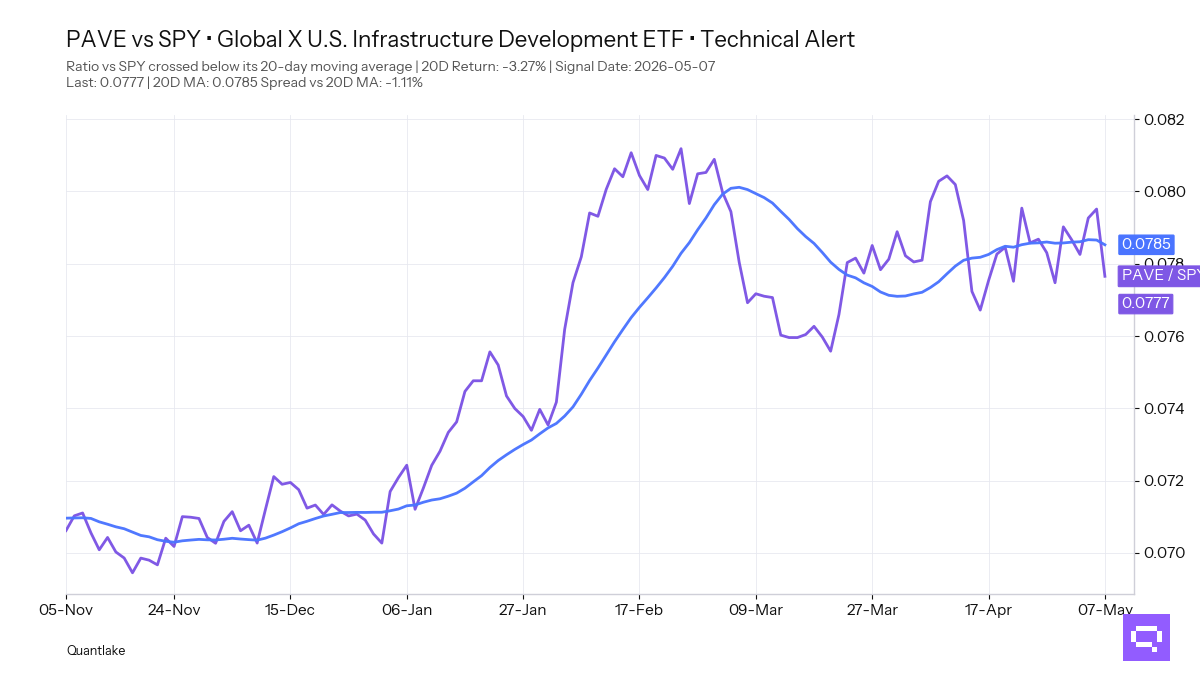
• We note that Infrastructure PAVE with a -3.27% period relative return versus SPY crossed below its 20-day ratio moving average. We place that alongside other specialty divergences where price has recovered without leadership, including DBMF, GLD, FTLS, JEPQ, VNQ, REET and USMV above their own 20-day moving averages but still lagging SPY.
FEATURED ETF — Global X U.S. Infrastructure Development ETF PAVE vs SPY
Other Technical Signal Events
EQUITY
↗ Price breakouts (cross-up 20D MA)
None on the close
↘ Price breakdowns (cross-down 20D MA)
• IDV - iShares International Select Dividend ETF · 20D perf: +0.48%
• XLB - Materials Select Sector · -0.52%
• DVY - iShares Select Dividend ETF · -0.66%
• EFAV - iShares MSCI EAFE Min Vol Factor ETF · -2.76%
• EWU - iShares MSCI United Kingdom ETF · -2.88%
↗ Leadership gains (cross-up 20D MA vs SPY)
None on the close
↘ Leadership losses (cross-down 20D MA vs SPY)
• IWM - iShares Russell 2000 ETF · 20D relative perf: +0.14%
• VWO - Vanguard FTSE Emerging Markets · -0.85%
• MDYG - SPDR® S&P 400 Mid Cap Growth ETF · -1.45%
FIXED INCOME
↗ Price breakouts (cross-up 20D MA)
None on the close
↘ Price breakdowns (cross-down 20D MA)
• JNK - SPDR® Bloomberg High Yield Bond ETF · 20D perf: +0.16%
• VCSH - Vanguard Short-Term Corporate Bond · unch.
• HYG - iShares iBoxx $ High Yield Corporate Bond ETF · unch.
• VCIT - Vanguard Intermediate-Term Corporate Bond · -0.18%
• MBB - iShares MBS ETF · -0.26%
• LQD - iShares iBoxx $ Investment Grade Corporate Bond ETF · -0.30%
↗ Leadership gains (cross-up 20D MA vs AGG)
• VCSH - Vanguard Short-Term Corporate Bond · 20D relative perf: +0.26%
↘ Leadership losses (cross-down 20D MA vs AGG)
• VCIT - Vanguard Intermediate-Term Corporate Bond · 20D relative perf: unch.
• LQD - iShares iBoxx $ Investment Grade Corporate Bond ETF · unch.
SPECIALTY
↗ Price breakouts (cross-up 20D MA)
• GLD - SPDR® Gold · 20D perf: -1.42%
• USMV - iShares MSCI USA Min Vol Factor ETF · +0.45%
• DBMF - iMGP DBi Managed Futures Strategy ETF · +0.92%
↘ Price breakdowns (cross-down 20D MA)
• ETHA - iShares Ethereum Trust ETF · 20D perf: +3.16%
• IBB - iShares Biotechnology ETF · -1.20%
↗ Leadership gains (cross-up 20D MA vs SPY)
None on the close
↘ Leadership losses (cross-down 20D MA vs SPY)
• PAVE - Global X U.S. Infrastructure Development ETF · 20D relative perf: -3.27%
COMMODITIES
↗ Price breakouts (cross-up 20D MA)
None on the close
↘ Price breakdowns (cross-down 20D MA)
None on the close
↗ Leadership gains (cross-up 20D MA vs SPY)
• SLV - iShares Silver · 20D relative perf: -2.70%
↘ Leadership losses (cross-down 20D MA vs SPY)
None on the close
Romain Gandon
CEO, Quantlake
Disclaimer: This article is for informational and educational purposes only and does not constitute investment advice. Past performance is not indicative of future results.