.png)
Daily Tactical Breadth Rebounds as Leadership Narrows
Benchmark outperformance stayed concentrated in growth, credit and EM Asia
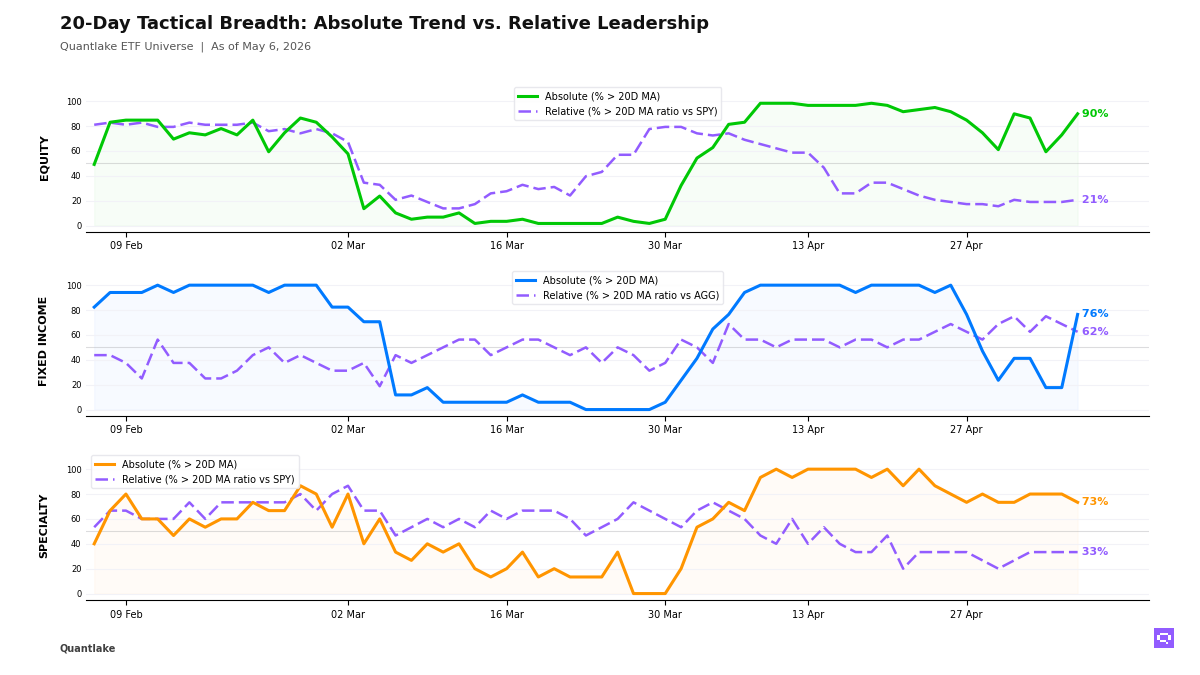
At the close, we saw equity participation broaden sharply across our universe, but we still read the move as benchmark-led rather than genuinely broad leadership. 53 of 59 ETFs (90%, +17pp on the day) held above their 20-day moving average, while only 12 of 58 (21%, +1.7pp on the day) outperformed the benchmark, leaving a +69pp abs/rel gap. We saw developed ex-US, China and low-volatility recover in price, yet relative leadership stayed concentrated in US growth, technology and EM Asia as Energy XLE and Utilities XLU remained outright weak spots.
In fixed income, we saw the cleanest absolute improvement of the session: 13 of 17 ETFs (76%, +58.8pp on the day) held above their 20-day moving average, up from 18% at the prior close, while 10 of 16 (62%, -6.2pp on the day) outperformed the benchmark. We read that as credit and spread product leadership through High Yield HYG, EM Sovereign Bonds EMB and Muni Bonds MUB, while Treasuries and long duration still failed to confirm.
Outside those buckets, we saw specialty lose some price participation as 11 of 15 ETFs (73%, -6.7pp on the day) held above their 20-day moving average while relative breadth stayed stuck at 33%, preserving a +40pp abs/rel gap; clean energy, momentum and semiconductors led, but managed futures, gold and low-volatility deteriorated. In commodities, we had a split tape: Copper CPER and Silver SLV reclaimed their 20-day moving averages, but oil, broad commodities and agriculture lost relative ground versus SPY, which is where our confirmation still falls short.
20-Day Tactical Breadth
Key Takeaways
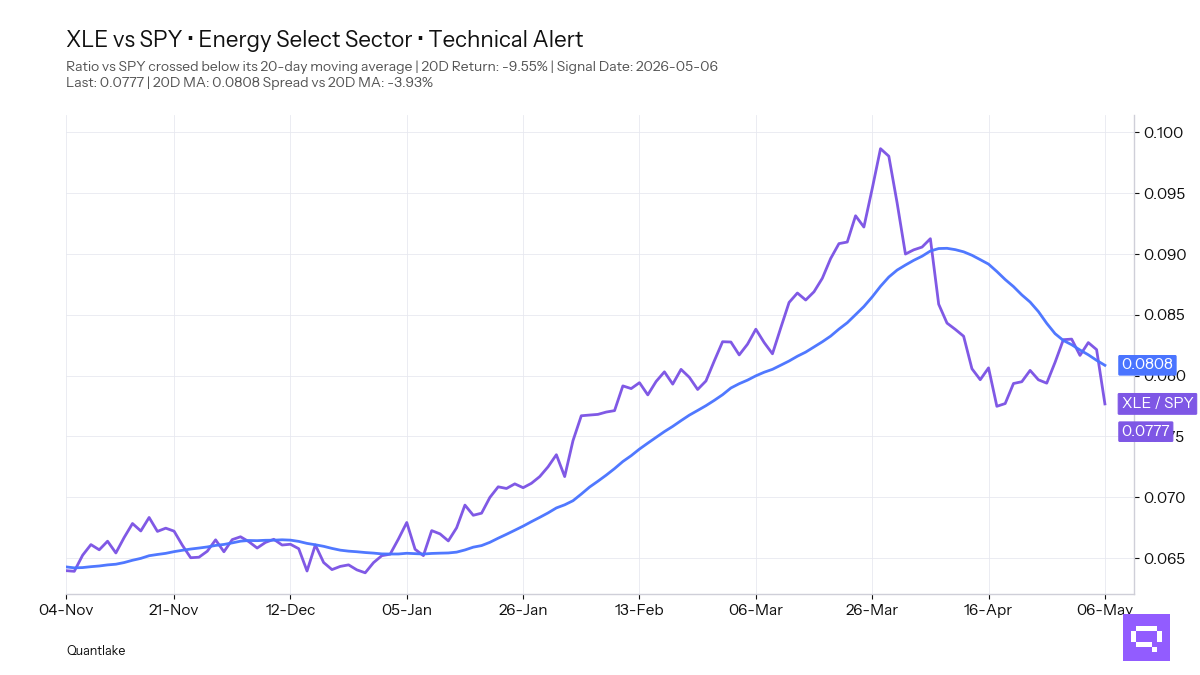
• We would separate the equity ratio moves by quality. Russell Growth IWF crossed above its SPY ratio 20-day moving average with a positive 20-day return, so we read it as strengthening leadership; Emg. Markets VWO and S&P MidCap Growth MDYG also crossed up, but both still carry negative 20-day relative returns, which keeps them in the early-stabilization camp. On the other side, S&P SmallCap Growth SLYG and Energy XLE both crossed down with negative 20-day relative returns, which is outright deterioration rather than a simple pause.
• We see a clear duration split inside fixed income. EM Sovereign Bonds EMB, High Yield HYG, High Yield Bonds JNK and Corp. Credit VCIT are aligned as relative leaders across daily, weekly and monthly frames, while government duration and long-duration Treasuries remain the persistent laggards. Short Corporate VCSH crossed above its 20-day moving average in price but slipped below its AGG ratio 20-day moving average, so front-end participation reads as stability more than leadership.
• We also see the specialty bucket as a case of recovery without full confirmation. Bitcoin, clean energy, momentum, infrastructure and semiconductors are doing the relative heavy lifting, while equity-income, biotech and real-estate names are above their 20-day moving averages in price but still lag the benchmark. Managed Futures DBMF and Min Volatility USMV sit in the weaker camp, which keeps the non-core part of our coverage from fully validating the broader price rebound.
FEATURED ETF — Energy Select Sector XLE
Other Technical Signal Events
EQUITY
↗ Price breakouts (cross-up 20D MA)
• EFAV - iShares MSCI EAFE Min Vol Factor ETF · 20D perf: -1.60%
• EWU - iShares MSCI United Kingdom ETF · -0.79%
• ACWV - iShares MSCI Global Min Vol Factor ETF · -0.42%
• XLB - Materials Select Sector · +1.28%
• INDA - iShares MSCI India ETF · +1.54%
• COPX - Global X Copper Miners ETF · +1.88%
• MCHI - iShares MSCI China ETF · +2.46%
• EFA - iShares MSCI EAFE ETF · +2.56%
• VGK - Vanguard FTSE Europe · +2.87%
• XLC - Communication Services Select Sector · +3.11%
• FXI - iShares China Large-Cap ETF · +3.14%
• IQLT - iShares MSCI Intl Quality Factor ETF · +3.14%
↘ Price breakdowns (cross-down 20D MA)
• XLE - Energy Select Sector · 20D perf: -1.81%
• XLU - Utilities Select Sector · -2.29%
↗ Leadership gains (cross-up 20D MA vs SPY)
• MDYG - SPDR® S&P 400 Mid Cap Growth ETF · 20D relative perf: -1.12%
• VWO - Vanguard FTSE Emerging Markets · -0.95%
• IWF - iShares Russell 1000 Growth ETF · +1.81%
↘ Leadership losses (cross-down 20D MA vs SPY)
• SLYG - SPDR® S&P 600 Small Cap Growth ETF · 20D relative perf: -0.90%
• XLE - Energy Select Sector · -9.55%
FIXED INCOME
↗ Price breakouts (cross-up 20D MA)
• BNDX - Vanguard Total International Bond · 20D perf: unch.
• MBB - iShares MBS ETF · unch.
• LQD - iShares iBoxx $ Investment Grade Corporate Bond ETF · +0.12%
• VCIT - Vanguard Intermediate-Term Corporate Bond · +0.20%
• VCSH - Vanguard Short-Term Corporate Bond · +0.20%
• HYG - iShares iBoxx $ High Yield Corporate Bond ETF · +0.49%
• MUB - iShares National Muni Bond ETF · +0.49%
• JNK - SPDR® Bloomberg High Yield Bond ETF · +0.61%
• EMB - iShares J.P. Morgan USD Emerging Markets Bond ETF · +1.65%
↘ Price breakdowns (cross-down 20D MA)
None on the close
↗ Leadership gains (cross-up 20D MA vs AGG)
None on the close
↘ Leadership losses (cross-down 20D MA vs AGG)
• VCSH - Vanguard Short-Term Corporate Bond · 20D relative perf: +0.11%
SPECIALTY
↗ Price breakouts (cross-up 20D MA)
• IBB - iShares Biotechnology ETF · 20D perf: +1.17%
↘ Price breakdowns (cross-down 20D MA)
• DBMF - iMGP DBi Managed Futures Strategy ETF · 20D perf: +0.89%
• USMV - iShares MSCI USA Min Vol Factor ETF · -0.14%
↗ Leadership gains (cross-up 20D MA vs SPY)
None on the close
↘ Leadership losses (cross-down 20D MA vs SPY)
None on the close
COMMODITIES
↗ Price breakouts (cross-up 20D MA)
• SLV - iShares Silver · 20D perf: +3.94%
• CPER - United States Copper LP · +6.50%
↘ Price breakdowns (cross-down 20D MA)
None on the close
↗ Leadership gains (cross-up 20D MA vs SPY)
None on the close
↘ Leadership losses (cross-down 20D MA vs SPY)
• USO - United States Oil Fund LP · 20D relative perf: -0.95%
• PDBC - Invesco Optimum Yield Diversified Commodity Strategy No K-1 ETF · -2.36%
• DBA - Invesco DB Agriculture · -3.80%
Romain Gandon
CEO, Quantlake
Disclaimer: This article is for informational and educational purposes only and does not constitute investment advice. Past performance is not indicative of future results.