.png)

Tactical Trends: Value and Ex-US Rebound as Relative Winners Thin
Price breadth reset higher; SPY-relative leadership concentrates.
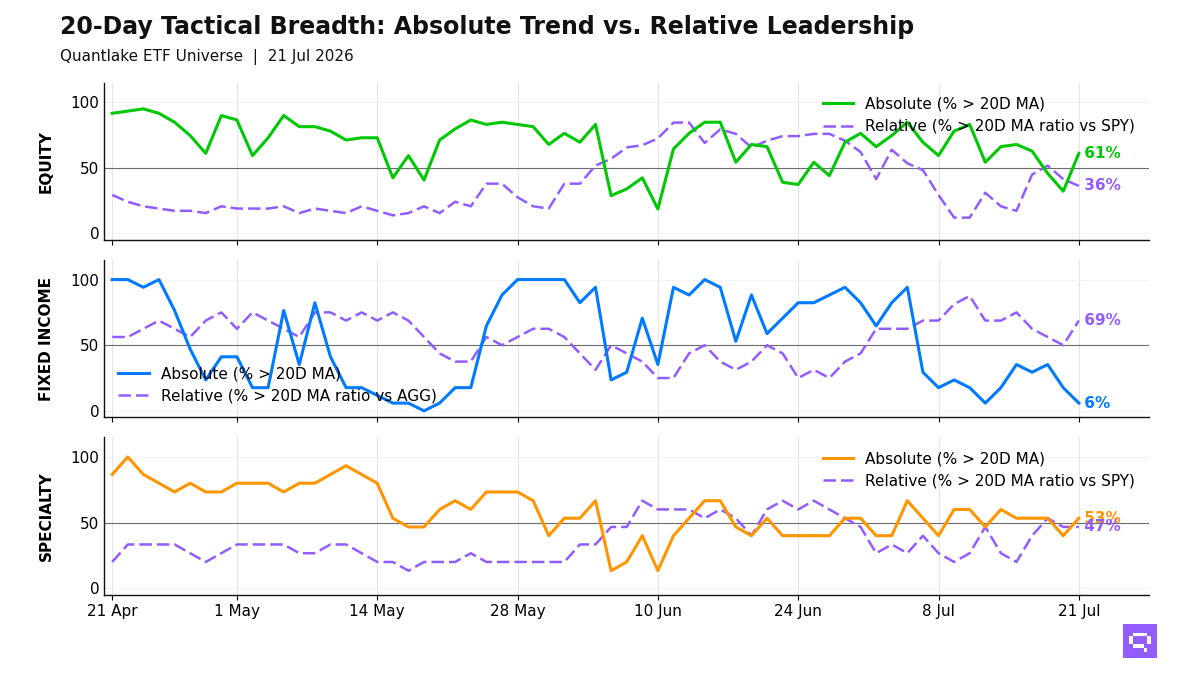
Value and developed ex-US equity regained traction across our ETF universe by the July 21 close, with 36 of 59 ETFs (61%, +28.8pp on the day) above their 20-day moving average (20D MA) and 21 of 58 ETFs (36%, -5.2pp) above their 20-day ratio moving average vs the S&P 500 SPY (20D ratio MA vs SPY). Low-volatility, dividend, and developed ex-US exposures fill the leader cluster. Small-cap, growth, and Asia-Pacific exposures lag the benchmark, and the price-relative gap is 25pp. The equity configuration resembles a price rebound that outruns benchmark-relative leadership.
Fixed income leadership is benchmark-relative, with 11 of 16 ETFs above their 20D ratio MA vs the Aggregate Bonds AGG and only VTIP above its 20D MA. Credit, mortgages, and short duration outperform the benchmark. 7-10yr Treasuries IEF and long duration lag. Bond leadership concentrates in spread product and shorter duration.
Specialty leadership centers on Gold GLD and real estate, with 7 of 15 ETFs above their 20D ratio MA vs the S&P 500 SPY, and Covered Calls Nasdaq JEPQ trades above its 20D MA and lags the benchmark. Commodity cross-timescale alignment is 100%, led by copper, broad commodities, and oil, with silver as the laggard. The specialty and commodity mix concentrates in hard assets and real estate.
20-Day Tactical Breadth
Key Takeaways
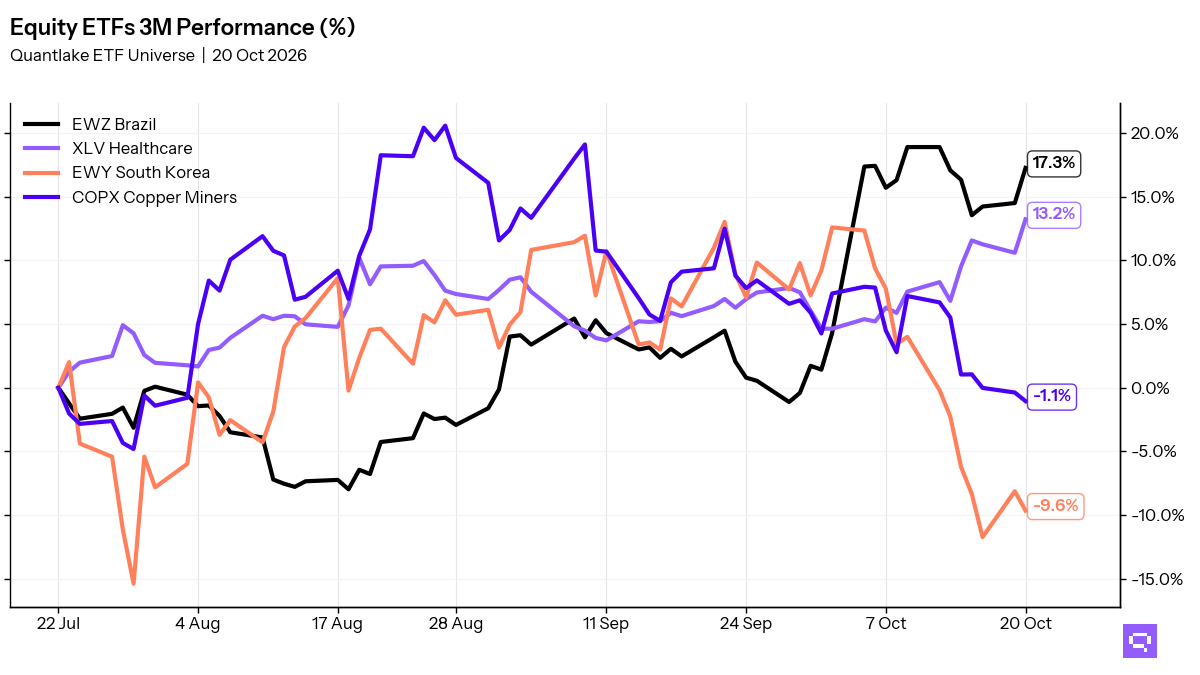
Copper Miners COPX, down 7.52% over the trailing 20-day window, crossed above its 20-day moving average. COPX also crossed above its 20D ratio MA versus the S&P 500 SPY after a 20-day relative return of down 8.00%. Copper now shows simultaneous price recovery and relative stabilization.
Equity cross-timescale alignment is 56%, with High Dividend VYM, Dividend Growth VIG, and Intl Value IVLU in the relative leader cluster and Germany equity, India equity, and growth exposure in the laggard cluster. The alignment map places value and income at the center of leadership.
Bond cross-timescale alignment is 65%. EM Sovereign Bonds EMB, Mortgage-Backed MBB, and short-duration exposure lead versus the Aggregate Bonds AGG, while 7-10yr Treasuries IEF, investment-grade credit, and long duration lag. The bond distribution rewards spread product and shorter duration, and rate-sensitive duration fills the weak side.
FEATURED ETF: Global X Copper Miners ETF COPX

Other Technical Signal Events
Equity: Price vs 20-day MA
| Signal | Ticker | Name | 20D perf |
|---|---|---|---|
| Cross-up | COPX | Global X Copper Miners ETF | -7.52% |
| Cross-up | VLUE | iShares MSCI USA Value Factor ETF | -4.45% |
| Cross-up | IMTM | iShares MSCI Intl Momentum Factor ETF | -3.40% |
| Cross-up | VT | Vanguard Total World Stock Index ETF | -0.90% |
| Cross-up | EFA | iShares MSCI EAFE ETF | -0.50% |
| Cross-up | SPYG | S&P 500 Growth ETF | -0.41% |
| Cross-up | IVLU | iShares Edge MSCI Intl Value Factor ETF | +0.28% |
| Cross-up | VO | Vanguard Mid-Cap Index ETF | +0.34% |
| Cross-up | URTH | iShares MSCI World ETF | +0.38% |
| Cross-up | VTI | Vanguard Total Stock Market Index ETF | +0.46% |
| Cross-up | IQLT | iShares MSCI Intl Quality Factor ETF | +0.55% |
| Cross-up | VGK | Vanguard FTSE Europe Index ETF | +0.58% |
| Cross-up | QUAL | iShares MSCI USA Quality Factor ETF | +1.07% |
| Cross-up | VIG | Vanguard Dividend Appreciation Index ETF | +1.09% |
| Cross-up | VYM | Vanguard High Dividend Yield Index ETF | +1.33% |
| Cross-up | IJR | iShares Core S&P Small-Cap ETF | +2.31% |
| Cross-up | XLV | Health Care Select Sector | +6.79% |
| Cross-down | XLP | Consumer Staples Select Sector | +2.29% |
Equity vs SPY: Price Ratio vs 20-day MA
| Signal | Ticker | Name | 20D rel perf |
|---|---|---|---|
| Cross-up | COPX | Global X Copper Miners ETF | -8.00% |
| Cross-up | IVLU | iShares Edge MSCI Intl Value Factor ETF | -0.24% |
| Cross-up | URTH | iShares MSCI World ETF | -0.15% |
| Cross-up | IQLT | iShares MSCI Intl Quality Factor ETF | unch. |
| Cross-up | VGK | Vanguard FTSE Europe Index ETF | unch. |
| Cross-down | XLV | Health Care Select Sector | +6.24% |
| Cross-down | XLC | Communication Services Select Sector | +2.43% |
| Cross-down | SDY | SPDR S&P Dividend ETF | +2.34% |
| Cross-down | XLP | Consumer Staples Select Sector | +1.76% |
| Cross-down | JEPI | JPMorgan Equity Premium Income ETF | +1.15% |
| Cross-down | RSP | Invesco S&P 500 Equal Weight ETF | +0.98% |
| Cross-down | VIG | Vanguard Dividend Appreciation Index ETF | +0.57% |
| Cross-down | QUAL | iShares MSCI USA Quality Factor ETF | +0.54% |
Fixed Income: Price vs 20-day MA
| Signal | Ticker | Name | 20D perf |
|---|---|---|---|
| Cross-down | JNK | SPDR Bloomberg High Yield Bond ETF | +0.14% |
| Cross-down | HYG | iShares iBoxx $ High Yield Corporate Bond ETF | unch. |
Fixed Income vs AGG: Price Ratio vs 20-day MA
| Signal | Ticker | Name | 20D rel perf |
|---|---|---|---|
| Cross-up | PFF | iShares Preferred and Income Securities ETF | -0.66% |
| Cross-up | BNDX | Vanguard Total International Bond Index ETF | -0.11% |
| Cross-up | EMB | iShares J.P. Morgan USD Emerging Markets Bond ETF | unch. |
| Cross-up | MBB | iShares MBS ETF | unch. |
| Cross-down | IEF | iShares 7-10 Year Treasury Bond ETF | +0.16% |
Specialty: Price vs 20-day MA
| Signal | Ticker | Name | 20D perf |
|---|---|---|---|
| Cross-up | GLD | SPDR Gold | -2.54% |
| Cross-up | JEPQ | JPMorgan Nasdaq Equity Premium Income ETF | -1.80% |
Specialty vs SPY: Price Ratio vs 20-day MA
| Signal | Ticker | Name | 20D rel perf |
|---|---|---|---|
| Cross-up | GLD | SPDR Gold | -3.05% |
| Cross-down | USMV | iShares MSCI USA Min Vol Factor ETF | +1.88% |
Romain Gandon
CEO, Quantlake
Disclaimer: This article is for informational and educational purposes only and does not constitute investment advice. Past performance is not indicative of future results.