Tactical Market Trends: Low Vol and Small Caps Gain Relative Strength
Only 4 of 15 specialty ETFs hold above their 20-day averages
Small-cap and low-volatility equity gained relative strength at the close on October 20, and Small-Cap IJR and Germany EWG crossed above their 20-day averages across our ETF universe. Across equity, 32 of 59 ETFs (54%, +10.2pp) hold above their 20-day moving averages (20D MA), and 35 of 58 (60%, +12.1pp) outperform the S&P 500 SPY on a ratio-MA basis. Low-volatility, quality, and small-cap names lead. Emerging markets, China, and momentum fill the laggard cluster.
Fixed income holds broad price participation, with 14 of 17 ETFs above their 20-day averages. Short-duration breadth is 2 of 2 above their price MAs, and long-duration breadth is 1 of 1 above its price MA. Relative winners vs the Aggregate Bonds AGG are long duration, inflation-linked debt, mortgages, munis, and Investment Grade Credit LQD. 3-7yr Treasuries IEI and Short TIPS VTIP crossed below their ratio MAs vs the benchmark.
Specialty leadership is limited to biotechnology, REITs, and low volatility, with 4 of 15 ETFs above their 20-day averages. Biotechnology IBB and Global REITs REET crossed above their price MAs and their ratio MAs vs the S&P 500 SPY. Oil and broad commodities align on both price and relative strength, and silver lags within commodities.
20-Day Tactical Breadth

Key Takeaways
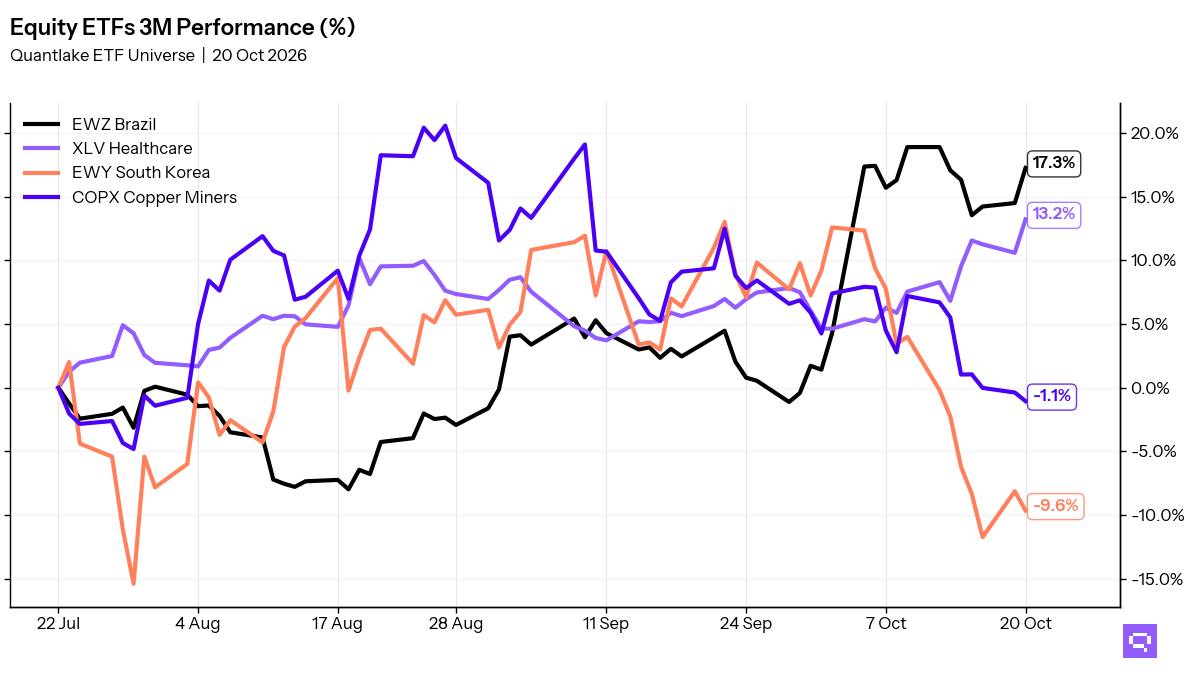
Developed markets EFA, S&P SmallCap Growth SLYG, and MSCI World URTH form the equity divergence cluster. Each trades below its 20-day average and above its ratio MA vs the S&P 500 SPY. Brazil EWZ and Quality QUAL hold daily, weekly, and monthly relative alignment.
Intermediate Treasuries VGIT joined 3-7yr Treasuries IEI and Short TIPS VTIP in ratio cross-down signals vs Aggregate Bonds AGG. Inflation-Protected Bonds TIP is the only fixed income name aligned on daily, weekly, and monthly relative strength. EM Sovereign Bonds EMB trades above its 20-day average and below its ratio MA vs the benchmark.
Managed Futures DBMF rose 3.41% over the past 20 sessions and crossed below its 20-day average. DBMF trades below its 20-day average and above its ratio MA vs the S&P 500 SPY.
Featured ETF: iMGP DBi Managed Futures Strategy ETF DBMF

Technical Signals
Equity: Price vs 20-day MA
| Signal | Ticker | Name | 20D perf |
|---|---|---|---|
| Cross-up | EWG | iShares MSCI Germany ETF | -2.86% |
| Cross-up | VGK | Vanguard FTSE Europe Index ETF | -2.52% |
| Cross-up | IDV | iShares International Select Dividend ETF | -2.43% |
| Cross-up | IJR | iShares Core S&P Small-Cap ETF | -1.46% |
| Cross-up | SLYV | SPDR S&P 600 Small Cap Value ETF | -1.22% |
| Cross-up | VB | Vanguard Small-Cap Index ETF | -1.18% |
Equity vs SPY: Price Ratio vs 20-day MA
| Signal | Ticker | Name | 20D rel perf |
|---|---|---|---|
| Cross-up | EWG | iShares MSCI Germany ETF | -2.31% |
| Cross-up | EFA | iShares MSCI EAFE ETF | -2.09% |
| Cross-up | SLYG | SPDR S&P 600 Small Cap Growth ETF | -1.11% |
| Cross-up | IJR | iShares Core S&P Small-Cap ETF | -0.91% |
| Cross-up | URTH | iShares MSCI World ETF | -0.69% |
| Cross-up | SLYV | SPDR S&P 600 Small Cap Value ETF | -0.66% |
| Cross-up | VB | Vanguard Small-Cap Index ETF | -0.62% |
Fixed Income: Price vs 20-day MA
| Signal | Ticker | Name | 20D perf |
|---|---|---|---|
| Cross-up | EMB | iShares J.P. Morgan USD Emerging Markets Bond ETF | -2.18% |
Fixed Income vs AGG: Price Ratio vs 20-day MA
| Signal | Ticker | Name | 20D rel perf |
|---|---|---|---|
| Cross-up | LQD | iShares iBoxx $ Investment Grade Corporate Bond ETF | -0.69% |
| Cross-down | VTIP | Vanguard Short-Term Inflation-Protected Securities Index ETF | +1.20% |
| Cross-down | IEI | iShares 3-7 Year Treasury Bond ETF | +0.59% |
| Cross-down | VGIT | Vanguard Intermediate-Term Treasury Index ETF | +0.50% |
Specialty: Price vs 20-day MA
| Signal | Ticker | Name | 20D perf |
|---|---|---|---|
| Cross-up | REET | iShares Global REIT ETF | -1.47% |
| Cross-up | IBB | iShares Biotechnology ETF | -0.15% |
| Cross-down | DBMF | iMGP DBi Managed Futures Strategy ETF | +3.41% |
Specialty vs SPY: Price Ratio vs 20-day MA
| Signal | Ticker | Name | 20D rel perf |
|---|---|---|---|
| Cross-up | REET | iShares Global REIT ETF | -0.92% |
| Cross-up | IBB | iShares Biotechnology ETF | +0.42% |
Related
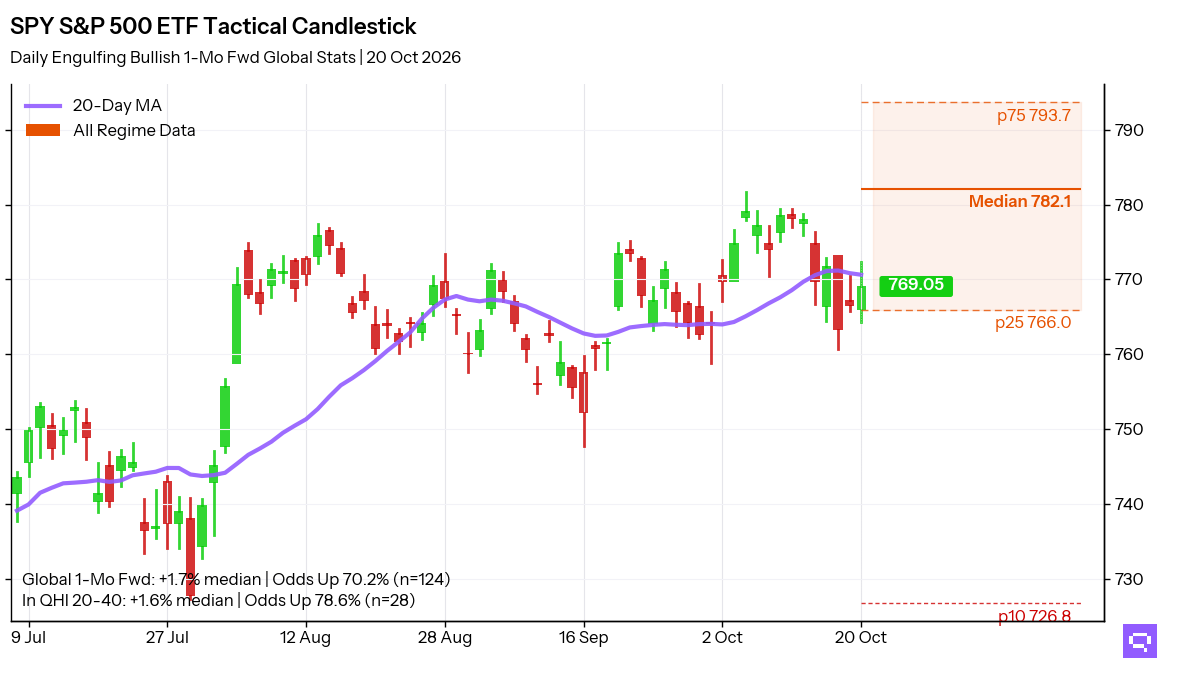
- SPY candlestick signals: forward returns by pattern and sentiment
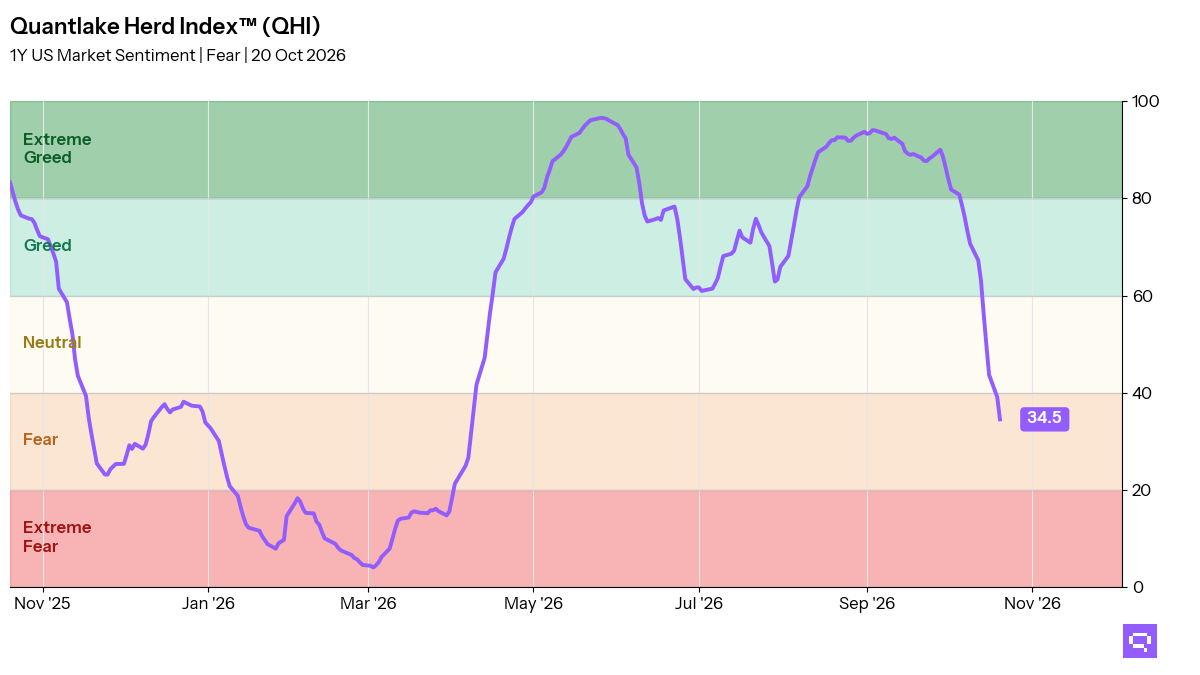
- Fear and greed: today's market sentiment reading
- ETF trend metrics explained
Romain Gandon
CEO, Quantlake
Disclaimer: This article is for informational and educational purposes only and does not constitute investment advice. Past performance is not indicative of future results.