
.png)
Tactical Trends: Treasuries Lead as Bond Breadth Splits by Credit
High price participation masks a 57pp gap in bond relative breadth
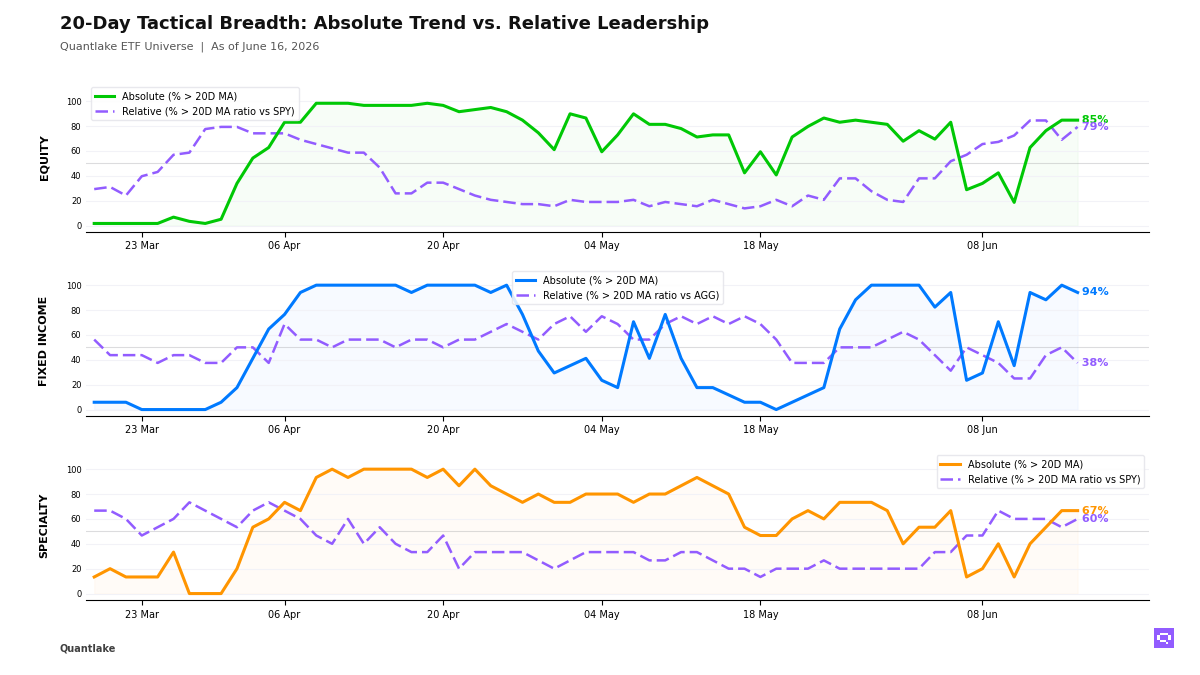
As of June 16, fixed income leans toward Treasuries and away from credit-sensitive income. Price breadth slipped to 16 of 17 ETFs (94%, -5.9pp) above their 20-day moving average (20D MA). Relative breadth fell to 6 of 16 (38%, -12.5pp) above their 20-day ratio moving average vs Aggregate Bonds AGG (20D ratio MA vs AGG), a 57pp gap. 7-10yr Treasuries IEF crossed above its 20D ratio MA vs AGG. High Yield Bonds JNK crossed below, and high yield, munis, and preferreds populated the laggard camp. The bond distribution favors duration and rate sensitivity over credit beta.
As of June 16, equity relative breadth broadened across our ETF universe. Price breadth stayed at 50 of 59 ETFs (85%, unchanged on the day) above their 20D MA. Relative breadth rose to 46 of 58 (79%, +10.3pp) outperforming the S&P 500 SPY. S&P Value SPYV crossed above its 20D ratio MA vs SPY. S&P Growth SPYG crossed below. The relative leader list tilted toward value, dividend, utilities, consumer discretionary, emerging markets, and developed ex-US exposure. The equity distribution is broad, and leadership tilts away from US growth and toward value, defensives, and non-US exposure.
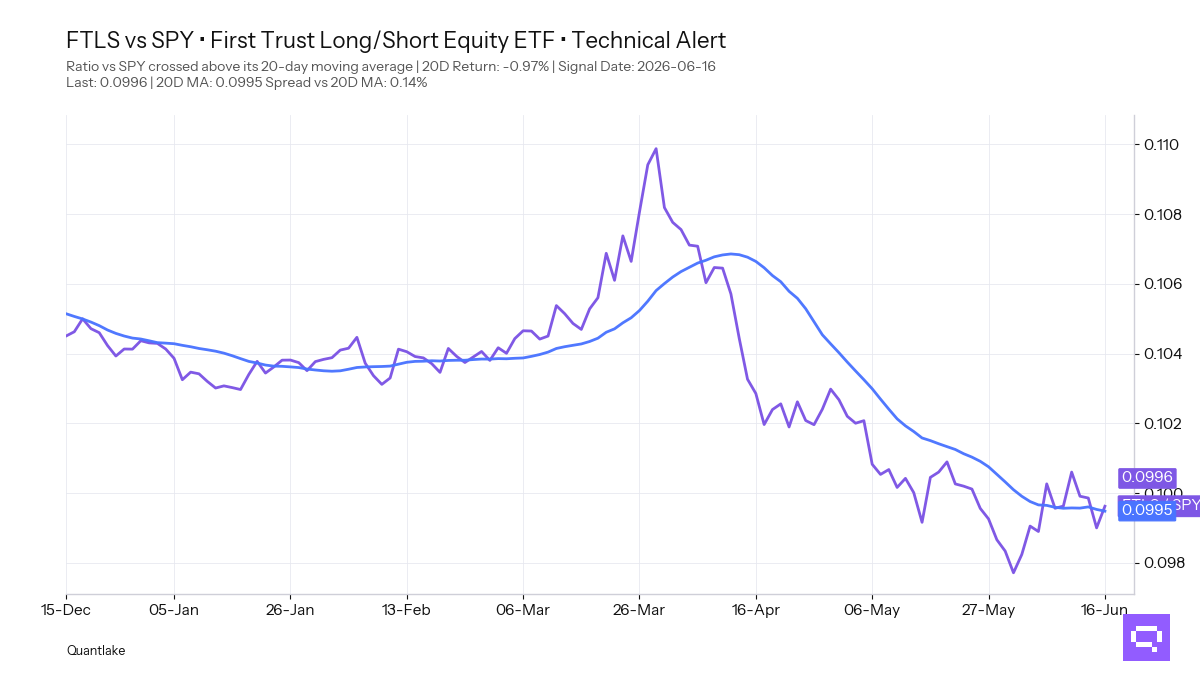
As of June 16, specialty relative breadth rose to 9 of 15 ETFs (60%, +6.7pp) outperforming the S&P 500 SPY. Price breadth held at 10 of 15 (67%, unchanged on the day) above their 20D MA. Long/Short Equity FTLS, with a -0.97% period relative return vs SPY, crossed above its 20-day ratio moving average. Commodities offered no fresh crossovers. Copper leads the cross-timescale leader list. Agriculture and silver sit on the laggard side. The specialty and commodity mix is selective and concentrated in equity-linked specialty exposures and copper.
20-Day Tactical Breadth
Key Takeaways
Daily, weekly, and monthly relative leadership in equity clustered in Asia-Pacific equity, emerging markets, developed ex-US equity, US small caps, and value-sensitive exposure. Daily, weekly, and monthly relative laggards clustered in low-volatility, China, Germany, Brazil, communication services, and energy. The equity leadership map rewards non-US and value-sensitive selection over US growth concentration.
IEF crossed above its 20D ratio MA versus AGG, and VTIP crossed below its 20D MA. Mortgages, international aggregate, EM debt, and investment grade joined the relative leader group. High yield, munis, preferreds, short government exposure, and short duration lagged the benchmark. The bond move reflects a quality and duration rotation rather than a generalized credit advance.
Against SPY, FTLS crossed above its 20-day ratio moving average after a -0.97% period relative return versus SPY. Specialty leadership aligned with semiconductors, momentum, infrastructure, biotech, real estate, and covered call exposure. Gold, bitcoin proxy, ethereum proxy, managed futures, clean energy, and minimum-volatility exposure sat on the laggard side. Copper is the only commodity with daily, weekly, and monthly alignment. The specialty and commodity map is narrow and equity-linked.
FEATURED ETF: First Trust Long/Short Equity ETF FTLS vs SPY
Other Technical Signal Events
EQUITY
↗ Price breakouts (cross-up 20D MA)
None on the close
↘ Price breakdowns (cross-down 20D MA)
None on the close
↗ Leadership gains (cross-up 20D MA vs SPY)
EWU - iShares MSCI United Kingdom ETF · 20D relative perf: -0.40%
JEPI - JPMorgan Equity Premium Income ETF · -0.13%
XLY - Consumer Discretionary Select Sector · +0.25%
URTH - iShares MSCI World ETF · +0.51%
SPYV - SPDR® Portfolio S&P 500 Value ETF · +0.65%
VYM - Vanguard High Dividend Yield · +0.83%
XLU - Utilities Select Sector · +0.95%
↘ Leadership losses (cross-down 20D MA vs SPY)
SPYG - SPDR® Portfolio S&P 500 Growth ETF · 20D relative perf: -0.43%
FIXED INCOME
↗ Price breakouts (cross-up 20D MA)
None on the close
↘ Price breakdowns (cross-down 20D MA)
VTIP - Vanguard Short-Term Inflation-Protected Securities · 20D perf: unch.
↗ Leadership gains (cross-up 20D MA vs AGG)
IEF - iShares 7-10 Year Treasury Bond ETF · 20D relative perf: +0.14%
↘ Leadership losses (cross-down 20D MA vs AGG)
MUB - iShares National Muni Bond ETF · 20D relative perf: unch.
JNK - SPDR® Bloomberg High Yield Bond ETF · unch.
PFF - iShares Preferred and Income Securities ETF · -0.77%
SPECIALTY
↗ Price breakouts (cross-up 20D MA)
None on the close
↘ Price breakdowns (cross-down 20D MA)
None on the close
↗ Leadership gains (cross-up 20D MA vs SPY)
FTLS - First Trust Long/Short Equity ETF · 20D relative perf: -0.97%
↘ Leadership losses (cross-down 20D MA vs SPY)
None on the close
COMMODITIES
No event on the close
Romain Gandon
CEO, Quantlake
Disclaimer: This article is for informational and educational purposes only and does not constitute investment advice. Past performance is not indicative of future results.


