.png)
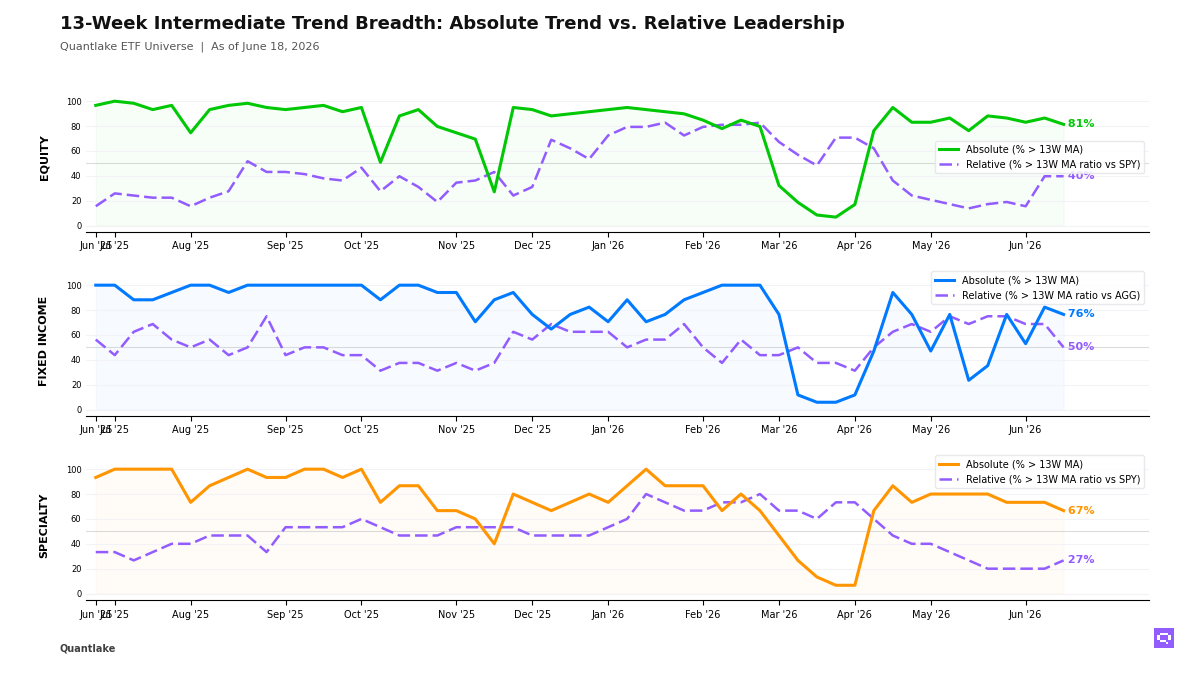
Tactical Trends: Tech Carries as Equity Leadership Narrows
Price breadth recovered, but fewer equity ETFs beat SPY
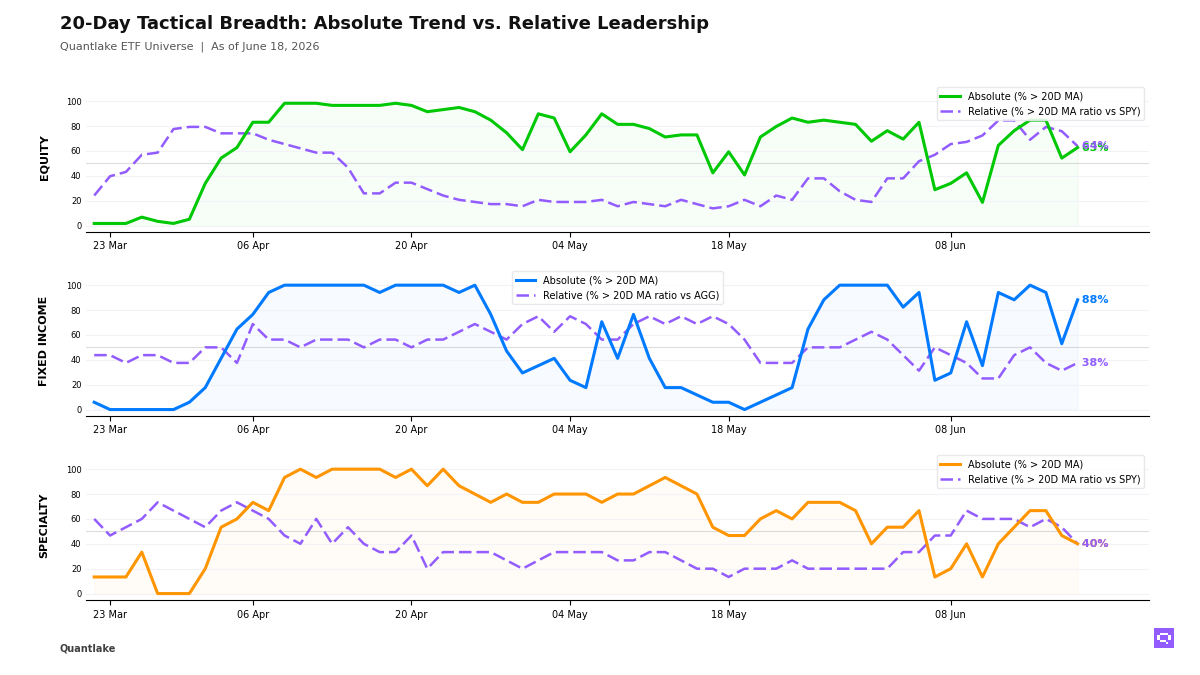
As of June 18, technology and growth lifted more of our ETF universe back above the 20-day moving average (20D MA): 37 of 59 equity ETFs (63%, +8.5pp on the day) sit above the 20D MA, while 37 of 58 ETFs (64%, -12.1pp) beat the S&P 500 SPY. Technology XLK and US Broad Market VTI crossed above their 20D MA, but dividend, low-volatility, Europe, the United Kingdom, and China lost relative ground versus the benchmark. The equity configuration is a breadth trap. Price participation recovered, but leadership narrowed into technology, growth, and select Asia-Pacific and emerging-market winners.
Fixed income price breadth jumped to 15 of 17 ETFs (88%, +35.3pp on the day) above their 20D MA, while only 6 of 16 ETFs (38%, +6.2pp) outperform the Aggregate Bonds AGG, a +51pp abs/rel gap. Long duration, intermediate Treasuries, EM debt, and investment grade lead on a relative basis, while high yield, preferreds, mortgages, and short corporates recovered in price without beating the benchmark. The bond move is a benchmark-led rebound centered in duration and select credit.
Specialty breadth fell to 6 of 15 ETFs (40%, -6.7pp on the day) above their 20D MA, and 6 of 15 ETFs (40%, -13.3pp) outperform the S&P 500 SPY. Semiconductors and momentum sit among the specialty leaders, while Gold Miners GDX broke below its 20D MA and its 20D ratio MA versus SPY, Global REITs REET lost relative ground, and agriculture and silver lagged across commodities. Specialty and commodity participation is concentrated in semiconductors and momentum, with hard assets and real estate on the weak side.
20-Day Tactical Breadth
Key Takeaways
Technology XLK, with a +8.07% period return, crossed above its 20-day moving average. US Technology IYW crossed above its 20D MA with a +5.98% 20-day return, and Nasdaq 100 QQQ crossed above its 20D MA with a +3.85% 20-day return. The growth complex regains price confirmation.
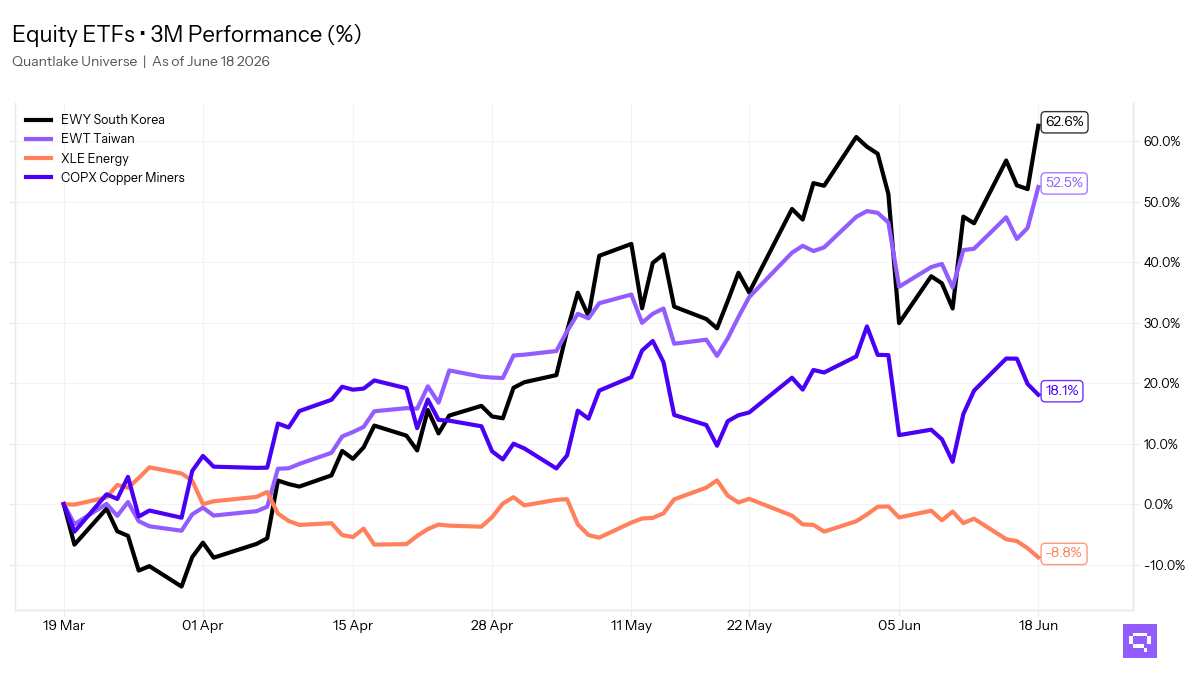
Emerging Markets EEM, Taiwan EWT, South Korea EWY, and Small Cap IJR sit on the multi-horizon relative leader list versus the S&P 500 SPY, alongside momentum and technology in the cross-timescale read. High Dividend DVY, Europe VGK, China MCHI, Consumer Staples XLP, and Healthcare XLV sit on the multi-horizon laggard list. The equity distribution favors growth, small caps, and Asia-Pacific over income and defensives.
7-10yr Treasuries IEF crossed above its 20-day ratio moving average versus Aggregate Bonds AGG, even with a -0.03% 20-day return. High Yield HYG, Preferred Stock PFF, Corporate Credit VCIT, and Short Corporate VCSH crossed above their 20D MA on price alone. Gold Miners GDX fell below its 20D MA and its 20D ratio MA versus the S&P 500 SPY, and Agriculture Basket DBA lost its 20D ratio MA versus SPY. Duration leads the bond rebound. Hard-asset sensitivity loses ground.
FEATURED ETF: Technology Select Sector XLK

Other Technical Signal Events
EQUITY
↗ Price breakouts (cross-up 20D MA)
SPYG - S&P 500 Growth ETF · 20D perf: +1.27%
URTH - iShares MSCI World ETF · +1.29%
VTI - Vanguard Total Stock Market Index ETF · +1.59%
QUAL - iShares MSCI USA Quality Factor ETF · +1.91%
VT - Vanguard Total World Stock Index ETF · +1.96%
QQQ - Invesco QQQ · +3.85%
IYW - iShares U.S. Technology ETF · +5.98%
XLK - Technology Select Sector · +8.07%
↘ Price breakdowns (cross-down 20D MA)
COPX - Global X Copper Miners ETF · 20D perf: +3.85%
VYM - Vanguard High Dividend Yield Index ETF · +0.93%
VGK - Vanguard FTSE Europe Index ETF · unch.
↗ Leadership gains (cross-up 20D MA vs SPY)
SPYG - S&P 500 Growth ETF · 20D relative perf: +0.53%
↘ Leadership losses (cross-down 20D MA vs SPY)
COPX - Global X Copper Miners ETF · 20D relative perf: +3.09%
XLV - Health Care Select Sector · +0.80%
VYM - Vanguard High Dividend Yield Index ETF · +0.19%
DVY - iShares Select Dividend ETF · unch.
SPYV - S&P 500 Value ETF · -0.11%
VGK - Vanguard FTSE Europe Index ETF · -0.70%
EWU - iShares MSCI United Kingdom ETF · -2.74%
XLP - Consumer Staples Select Sector · -3.31%
FIXED INCOME
↗ Price breakouts (cross-up 20D MA)
VCSH - Vanguard Short-Term Corporate Bond Index ETF · 20D perf: +0.34%
IEI - iShares 3-7 Year Treasury Bond ETF · +0.36%
VGIT - Vanguard Intermediate-Term Treasury Index ETF · +0.53%
HYG - iShares iBoxx $ High Yield Corporate Bond ETF · +0.70%
PFF - iShares Preferred and Income Securities ETF · +0.83%
VCIT - Vanguard Intermediate-Term Corporate Bond Index ETF · +0.89%
↘ Price breakdowns (cross-down 20D MA)
None on the close
↗ Leadership gains (cross-up 20D MA vs AGG)
IEF - iShares 7-10 Year Treasury Bond ETF · 20D relative perf: unch.
↘ Leadership losses (cross-down 20D MA vs AGG)
None on the close
SPECIALTY
↗ Price breakouts (cross-up 20D MA)
None on the close
↘ Price breakdowns (cross-down 20D MA)
GDX - VanEck Gold Miners ETF · 20D perf: -4.46%
↗ Leadership gains (cross-up 20D MA vs SPY)
None on the close
↘ Leadership losses (cross-down 20D MA vs SPY)
REET - iShares Global REIT ETF · 20D relative perf: -1.20%
GDX - VanEck Gold Miners ETF · -5.16%
COMMODITIES
↗ Price breakouts (cross-up 20D MA)
None on the close
↘ Price breakdowns (cross-down 20D MA)
None on the close
↗ Leadership gains (cross-up 20D MA vs SPY)
None on the close
↘ Leadership losses (cross-down 20D MA vs SPY)
DBA - Invesco DB Agriculture · 20D relative perf: -5.49%
Romain Gandon
CEO, Quantlake
Disclaimer: This article is for informational and educational purposes only and does not constitute investment advice. Past performance is not indicative of future results.