.png)

Tactical Trends: Tech and North Asia Stand Apart in Equity Weakness
Price recoveries lose force with only 8 of 58 equity ETFs beating SPY.
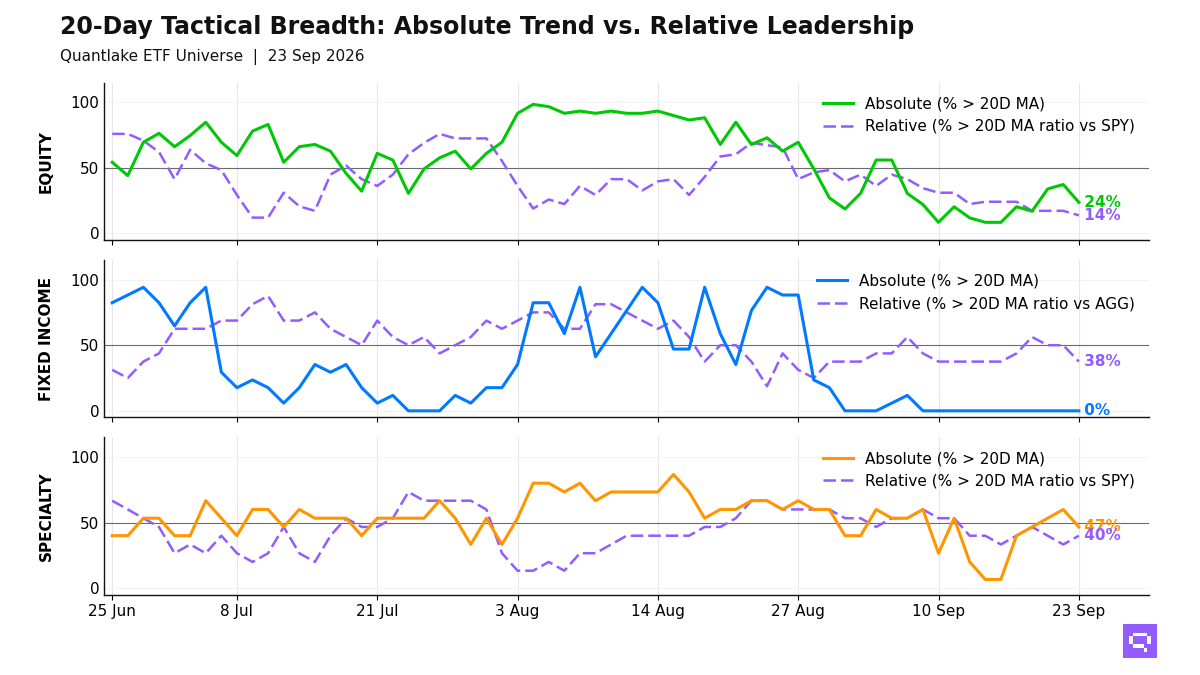
Equity participation gives way outside technology and North Asia across our ETF universe at the September 23 close. Only 14 of 59 equity ETFs (24%, -13.6pp) hold above their 20-day moving average (20D MA), and 8 of 58 (14%, -3.5pp) beat the S&P 500 SPY on a ratio basis. Taiwan, South Korea, and Quality Factor QUAL stay on the relative leader side. Emerging Markets EEM trades above its 20-day average and below the benchmark on a ratio basis.
Fixed income leadership is limited to high-yield credit, preferreds, and short duration, with 6 of 16 ETFs (38%) outperforming the Aggregate Bonds AGG on a ratio basis. Long Treasuries TLT, investment grade, mortgages, and municipals trail the benchmark. No bond ETF holds above its own 20-day average.
Specialty leadership centers on Managed Futures DBMF, crypto-linked funds, momentum, and semiconductors vs the S&P 500 SPY. Clean energy, real estate, gold, and biotech fill the laggard cluster. Commodities split cleanly. Oil USO crossed above its 20-day average. Broad commodities strengthened vs the benchmark. Silver fell below both price and ratio averages.
20-Day Tactical Breadth
Key Takeaways
Developed Markets VEA, Global Equities VT, and MSCI World URTH crossed below their 20-day averages. Developed ex-US and global beta sit in the multi-horizon laggard cluster alongside low-volatility and dividend-heavy U.S. equity.
Short TIPS VTIP crossed above its 20-day ratio MA vs Aggregate Bonds AGG. EM Sovereign Bonds EMB, Investment Grade Credit LQD, and Long Treasuries TLT crossed below their ratio MAs. Bond leadership stays concentrated in short duration, high yield, and preferreds.
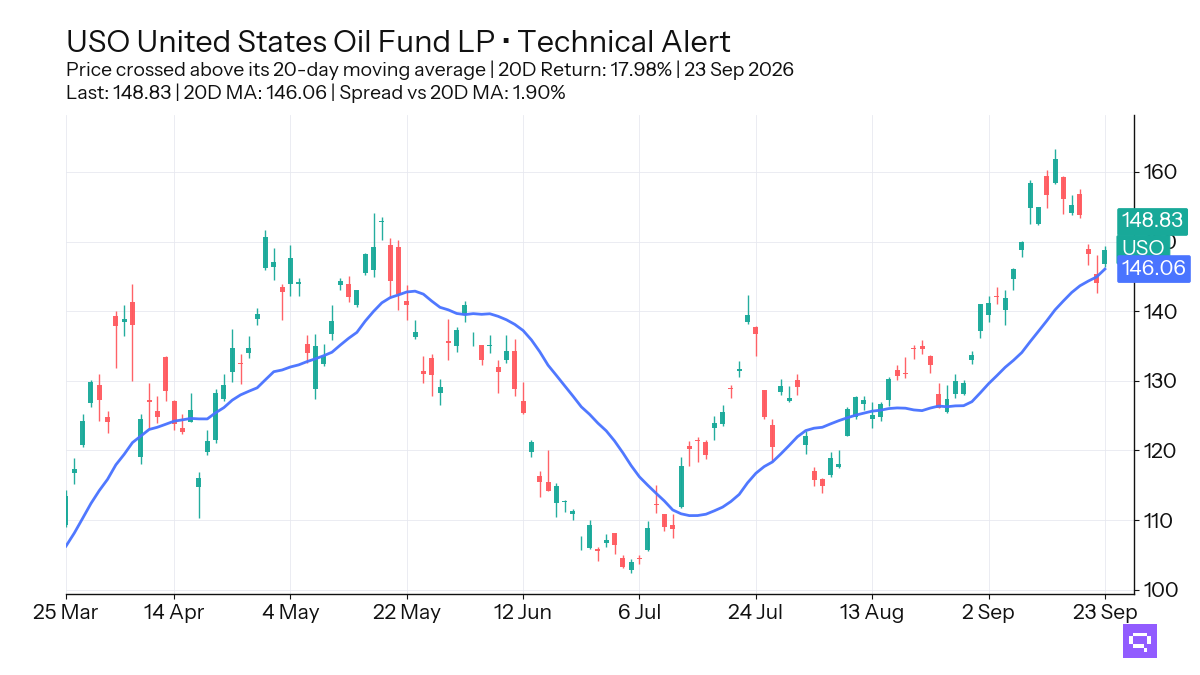
Oil USO, up 17.98% over the trailing 20-day window, crossed above its 20-day MA. Its ratio vs the S&P 500 SPY also crossed above its 20-day ratio MA. Broad Commodities PDBC crossed above its ratio MA. Silver SLV crossed below both of its 20-day averages.
FEATURED ETF: United States Oil Fund LP USO
Technical Signal Alerts
Equity: Price vs 20-day MA
| Signal | Ticker | Name | 20D perf |
|---|---|---|---|
| Cross-down | EWZ | iShares MSCI Brazil ETF | +4.15% |
| Cross-down | VWO | Vanguard FTSE Emerging Markets Index ETF | -0.67% |
| Cross-down | URTH | iShares MSCI World ETF | -0.71% |
| Cross-down | VT | Vanguard Total World Stock Index ETF | -0.78% |
| Cross-down | IMTM | iShares MSCI Intl Momentum Factor ETF | -2.22% |
| Cross-down | VEA | Vanguard FTSE Developed Markets Index ETF | -2.97% |
| Cross-down | XLV | Health Care Select Sector | -3.33% |
| Cross-down | MCHI | iShares MSCI China ETF | -3.54% |
Equity vs SPY: Price Ratio vs 20-day MA
| Signal | Ticker | Name | 20D rel perf |
|---|---|---|---|
| Cross-up | QUAL | iShares MSCI USA Quality Factor ETF | -1.14% |
| Cross-down | EWZ | iShares MSCI Brazil ETF | +3.64% |
| Cross-down | EWJ | iShares MSCI Japan ETF | +0.98% |
| Cross-down | EEM | iShares MSCI Emerging Markets ETF | +0.19% |
Fixed Income vs AGG: Price Ratio vs 20-day MA
| Signal | Ticker | Name | 20D rel perf |
|---|---|---|---|
| Cross-up | VTIP | Vanguard Short-Term Inflation-Protected Securities Index ETF | +1.10% |
| Cross-down | LQD | iShares iBoxx $ Investment Grade Corporate Bond ETF | unch. |
| Cross-down | EMB | iShares J.P. Morgan USD Emerging Markets Bond ETF | -0.11% |
| Cross-down | TLT | iShares 20+ Year Treasury Bond ETF | -0.94% |
Specialty: Price vs 20-day MA
| Signal | Ticker | Name | 20D perf |
|---|---|---|---|
| Cross-down | ICLN | iShares Global Clean Energy ETF | -1.30% |
| Cross-down | IBB | iShares Biotechnology ETF | -4.52% |
Specialty vs SPY: Price Ratio vs 20-day MA
| Signal | Ticker | Name | 20D rel perf |
|---|---|---|---|
| Cross-up | DBMF | iMGP DBi Managed Futures Strategy ETF | +4.16% |
Commodities: Price vs 20-day MA
| Signal | Ticker | Name | 20D perf |
|---|---|---|---|
| Cross-up | USO | United States Oil Fund LP | +17.98% |
| Cross-down | SLV | iShares Silver | -6.68% |
Commodities vs SPY: Price Ratio vs 20-day MA
| Signal | Ticker | Name | 20D rel perf |
|---|---|---|---|
| Cross-up | PDBC | Invesco Optimum Yield Diversified Commodity Strategy No K-1 ETF | +7.39% |
| Cross-up | USO | United States Oil Fund LP | +17.40% |
| Cross-down | SLV | iShares Silver | -7.14% |
Romain Gandon
CEO, Quantlake
Disclaimer: This article is for informational and educational purposes only and does not constitute investment advice. Past performance is not indicative of future results.