.png)

Tactical Trends: Low-Volatility and International Rebounds Lag the S&P 500
Price recovery outruns relative leadership across the ETF universe
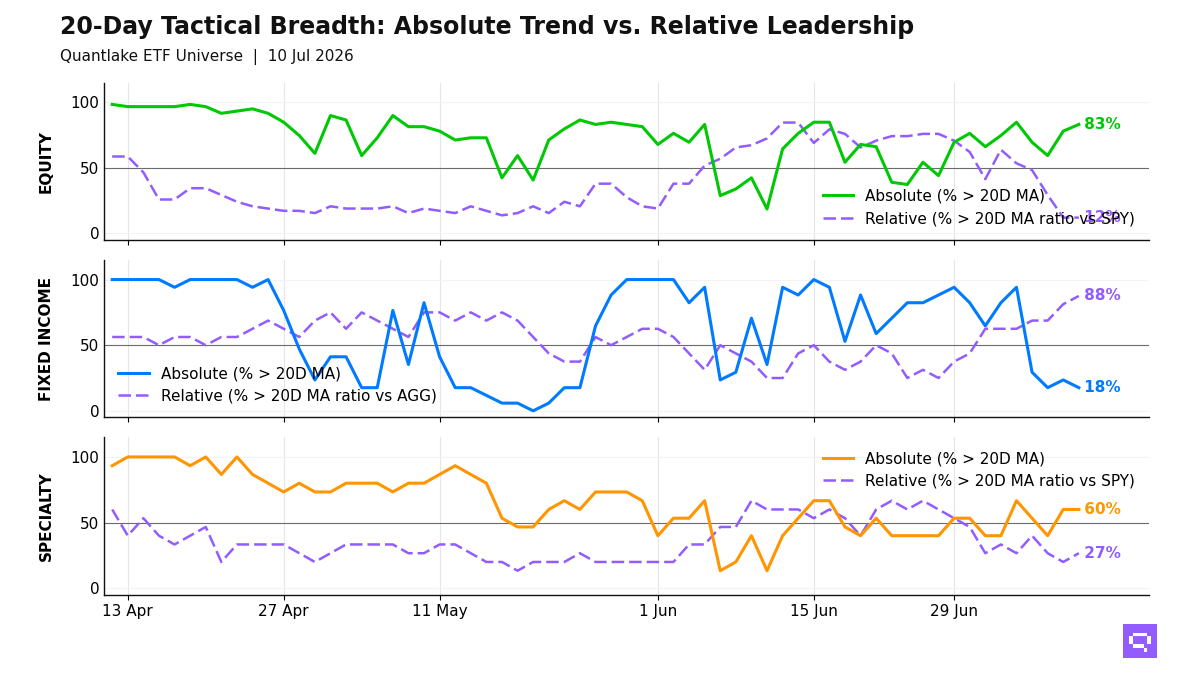
Defensive and international rebounds define the July 10 close. 49 of 59 ETFs (83%, +5.1pp on the day) sit above their 20-day moving average, and only 7 of 58 (12%, unchanged on the day) sit above their 20-day ratio moving average versus S&P 500 SPY. Low-volatility and developed international equity populate the price winners. Communication Services XLC and High Dividend DVY joined the relative winner cluster versus SPY. The +71pp price-relative gap places the ETF universe in a rebound where price recovery outruns leadership, consistent with a narrow benchmark-led advance.
Fixed income shows only 3 of 17 ETFs above their 20D MA, concentrated in high-yield credit and short-duration inflation protection, even as 14 of 16 beat the Aggregate Bonds AGG. Global Bonds BNDX crossed above its 20D ratio MA versus AGG. Long-duration TLT and Investment Grade LQD lag the benchmark. The bond cross-section favors lower rate sensitivity over duration.
Specialty leadership centers on crypto and biotech. Bitcoin Trust IBIT and Biotech IBB beat the S&P 500 SPY, while gold-related exposure and semiconductors lag on a relative basis. Copper CPER crossed above its 20D MA. Silver and broad commodity exposure fill the laggard cluster. Specialty and commodity leadership is selective.
20-Day Tactical Breadth
Key Takeaways
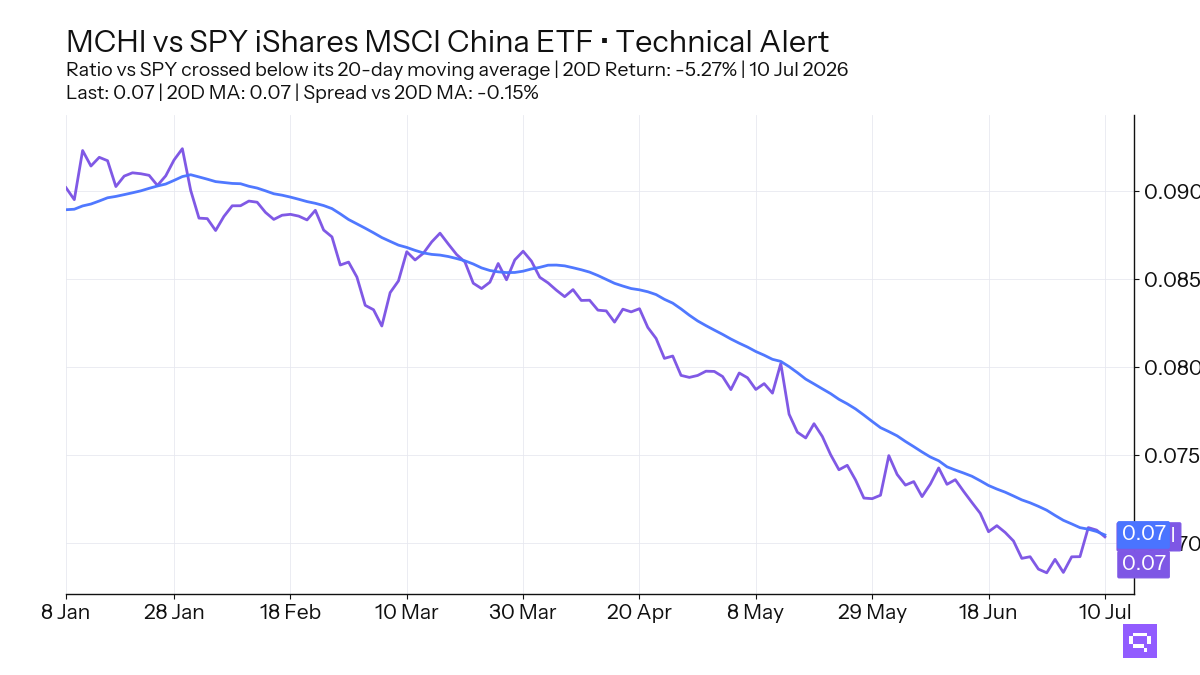
China MCHI, down 5.27% relative to SPY over the trailing 20-day window, crossed below its 20-day ratio moving average. China also sits in the cross-timescale relative laggard cluster, so the latest signal extends an established relative fade.
Russell 2000 IWM crossed below its 20D MA as Consumer Staples XLP and Real Estate XLRE crossed above theirs. High Dividend DVY and Communication Services XLC also moved above their 20D ratio MA versus SPY, so the equity rotation favors income and defensives over smaller-cap beta.
Global Bonds BNDX crossed above its 20D ratio MA versus AGG, and Short Corporate VCSH crossed below its 20D MA. Fixed income relative winners span international bonds, EM debt, mortgages, munis, and short duration, while long-duration TLT and Investment Grade LQD lag; duration sensitivity is the weak point.
FEATURED ETF: iShares MSCI China ETF MCHI vs SPY
Other Technical Signal Events
Equity: Price vs 20-day MA
| Signal | Ticker | Name | 20D perf |
|---|---|---|---|
| Cross-up | XLP | Consumer Staples Select Sector | -0.91% |
| Cross-up | XLRE | The Real Estate Select Sector | -0.34% |
| Cross-up | MDYV | SPDR S&P 400 Mid Cap Value ETF | +2.96% |
| Cross-up | INDA | iShares MSCI India ETF | +4.23% |
| Cross-down | IWM | iShares Russell 2000 ETF | +5.19% |
Equity vs SPY: Price Ratio vs 20-day MA
| Signal | Ticker | Name | 20D rel perf |
|---|---|---|---|
| Cross-up | XLC | Communication Services Select Sector | -3.36% |
| Cross-up | DVY | iShares Select Dividend ETF | -1.29% |
| Cross-down | SLYG | SPDR S&P 600 Small Cap Growth ETF | +2.85% |
| Cross-down | MCHI | iShares MSCI China ETF | -5.27% |
Fixed Income: Price vs 20-day MA
| Signal | Ticker | Name | 20D perf |
|---|---|---|---|
| Cross-down | VCSH | Vanguard Short-Term Corporate Bond Index ETF | +0.25% |
Fixed Income vs AGG: Price Ratio vs 20-day MA
| Signal | Ticker | Name | 20D rel perf |
|---|---|---|---|
| Cross-up | BNDX | Vanguard Total International Bond Index ETF | +0.51% |
Specialty vs SPY: Price Ratio vs 20-day MA
| Signal | Ticker | Name | 20D rel perf |
|---|---|---|---|
| Cross-up | IBIT | iShares Bitcoin | -1.02% |
Commodities: Price vs 20-day MA
| Signal | Ticker | Name | 20D perf |
|---|---|---|---|
| Cross-up | CPER | United States Copper LP | +0.72% |
Romain Gandon
CEO, Quantlake
Disclaimer: This article is for informational and educational purposes only and does not constitute investment advice. Past performance is not indicative of future results.