.png)

Tactical Trends: International Equity and Growth Reclaim Relative Ground
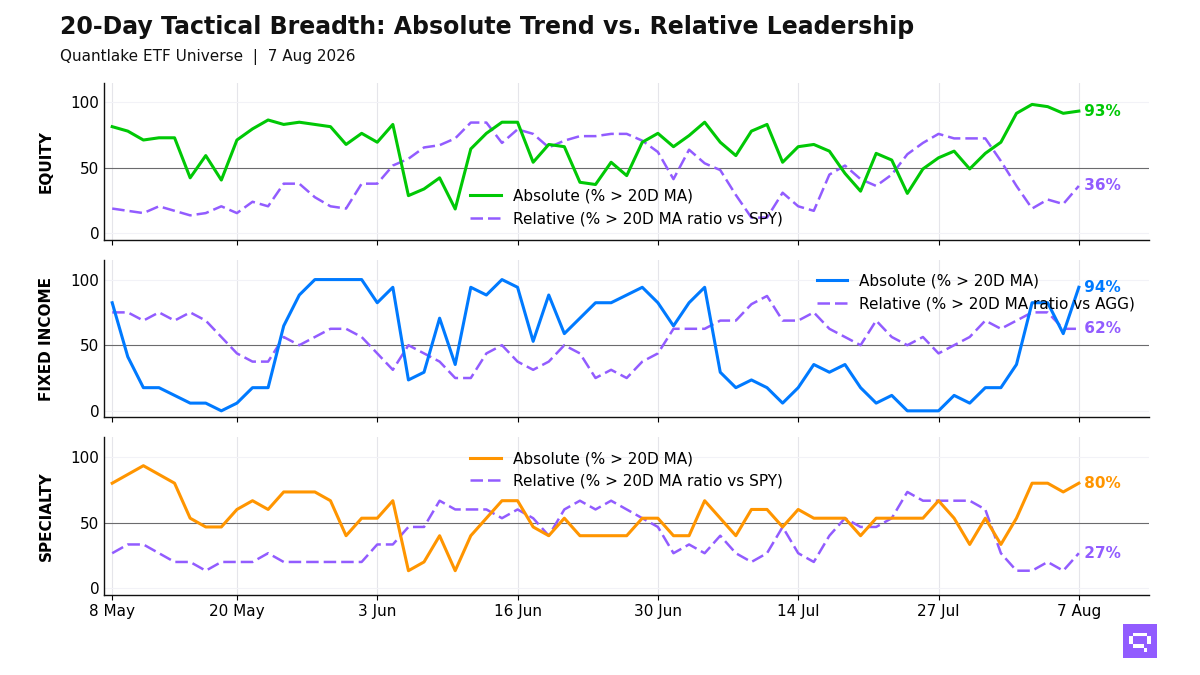
Only 36% beat SPY, so the rebound is broader in price than leadership.
Relative leadership in developed ex-US equity and U.S. growth is stronger at the close on August 7, with 55 of 59 equity ETFs (93%, +1.7pp on the day) above their 20-day moving average (20D MA) and 21 of 58 (36%, +13.8pp) above their 20-day ratio moving average vs S&P 500 SPY (20D ratio MA vs SPY). Developed ex-US equity, quality, and U.S. growth supply the relative leaders. Low-volatility, dividend, and emerging markets fill the price-recovery camp. The 57pp price-relative gap leaves participation ahead of leadership. Equity participation is broad, and the leadership field is reopening from a low base rather than broadening across the full cross-section.
Fixed income participation is broad, with 16 of 17 ETFs (94%) above their 20D MA. High-yield credit, EM debt, and Mortgage-Backed MBB outperform the Aggregate Bonds AGG. 7-10yr Treasuries IEF, Investment Grade Credit LQD, and long-duration TLT lag. Bond leadership concentrates in spread sectors and belly duration. Long-duration rate sensitivity trails.
Specialty leadership is selective, with 4 of 15 ETFs (27%) outperforming the S&P 500 SPY. Gold-related names and Biotechnology IBB hold the relative leaders. Bitcoin proxies and clean energy trade above their 20D MA without beating the benchmark. Copper CPER crossed below its 20D ratio MA vs SPY. Specialty and commodity leadership concentrates in metals and healthcare.
20-Day Tactical Breadth
Key Takeaways
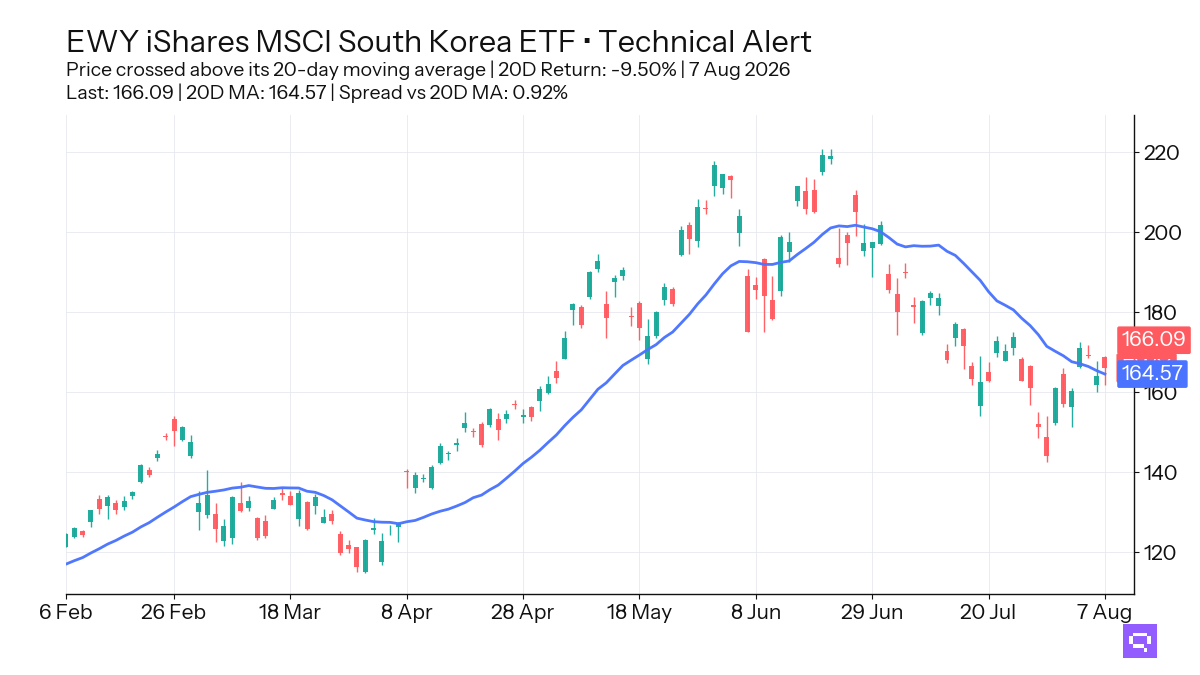
South Korea EWY, down 9.50% over the trailing 20-day window, crossed above its 20-day moving average. EWY also sits in the divergent equity bucket, with price above its 20D MA and relative performance below the S&P 500 SPY, so the move marks price recovery without leadership.
Nasdaq 100 QQQ and Semiconductors SMH crossed above their 20D ratio MA versus S&P 500 SPY after 20-day relative losses of 2.70% and 6.89%. Each signal sits in a stabilizing negative state, so the relative recovery is early.
Mortgage-Backed MBB crossed above its 20D MA and its 20D ratio MA versus Aggregate Bonds AGG, and Short TIPS VTIP crossed below its 20D ratio MA versus AGG. The bond cross-section rewards mortgages and spread sectors, and short inflation protection loses relative ground.
FEATURED ETF: iShares MSCI South Korea ETF EWY
Other Technical Signal Events
Equity: Price vs 20-day MA
| Signal | Ticker | Name | 20D perf |
|---|---|---|---|
| Cross-up | EWY | iShares MSCI South Korea ETF | -9.50% |
| Cross-up | DVY | iShares Select Dividend ETF | +1.54% |
| Cross-down | XLE | Energy Select Sector | +4.39% |
Equity vs SPY: Price Ratio vs 20-day MA
| Signal | Ticker | Name | 20D rel perf |
|---|---|---|---|
| Cross-up | QQQ | Invesco QQQ | -2.70% |
| Cross-up | VT | Vanguard Total World Stock Index ETF | unch. |
| Cross-up | VTI | Vanguard Total Stock Market Index ETF | unch. |
| Cross-up | VEA | Vanguard FTSE Developed Markets Index ETF | +0.25% |
| Cross-up | URTH | iShares MSCI World ETF | +0.42% |
| Cross-up | MDYG | SPDR S&P 400 Mid Cap Growth ETF | +0.54% |
| Cross-up | XLB | Materials Select Sector | +1.41% |
| Cross-up | IQLT | iShares MSCI Intl Quality Factor ETF | +1.79% |
Fixed Income: Price vs 20-day MA
| Signal | Ticker | Name | 20D perf |
|---|---|---|---|
| Cross-up | MUB | iShares National Muni Bond ETF | -0.73% |
| Cross-up | LQD | iShares iBoxx $ Investment Grade Corporate Bond ETF | -0.42% |
| Cross-up | TIP | iShares TIPS Bond ETF | -0.24% |
| Cross-up | IEF | iShares 7-10 Year Treasury Bond ETF | -0.15% |
| Cross-up | MBB | iShares MBS ETF | -0.11% |
Fixed Income vs AGG: Price Ratio vs 20-day MA
| Signal | Ticker | Name | 20D rel perf |
|---|---|---|---|
| Cross-up | MBB | iShares MBS ETF | unch. |
| Cross-down | VTIP | Vanguard Short-Term Inflation-Protected Securities Index ETF | +0.20% |
Specialty: Price vs 20-day MA
| Signal | Ticker | Name | 20D perf |
|---|---|---|---|
| Cross-up | ICLN | iShares Global Clean Energy ETF | -4.94% |
Specialty vs SPY: Price Ratio vs 20-day MA
| Signal | Ticker | Name | 20D rel perf |
|---|---|---|---|
| Cross-up | SMH | VanEck Semiconductor ETF | -6.89% |
| Cross-up | IBB | iShares Biotechnology ETF | +0.50% |
Commodities vs SPY: Price Ratio vs 20-day MA
| Signal | Ticker | Name | 20D rel perf |
|---|---|---|---|
| Cross-down | CPER | United States Copper LP | +2.54% |
Romain Gandon
CEO, Quantlake
Disclaimer: This article is for informational and educational purposes only and does not constitute investment advice. Past performance is not indicative of future results.