.png)

Tactical Trends: Healthcare Rotation Meets an Equity Price Break
Relative leadership turns defensive as price confirmation contracts
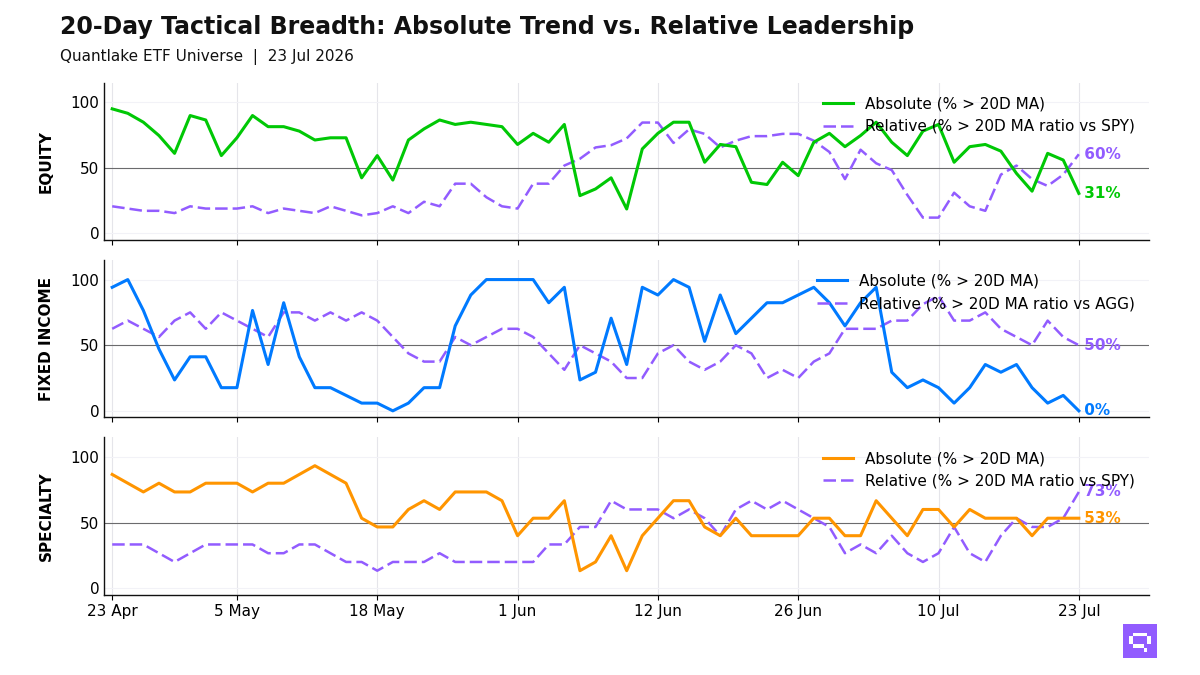
Healthcare rotation and low-volatility leadership define the close on July 23 as price signals broke across broad-market, growth, and international equity exposures. In equity, 18 of 59 ETFs (31%, -25.4pp on the day) hold above their 20-day moving average (20D MA), while 35 of 58 ETFs (60%, +15.5pp) hold above their 20-day ratio moving average vs S&P 500 SPY (20D ratio MA vs SPY); the -30pp price-relative gap centers relative winners in healthcare, dividends, and low volatility. Equity leadership is defensive and benchmark-relative, with price weakness concentrated in higher-beta and international exposures.
All 17 fixed-income ETFs sit below their 20D MA. Relative winners vs Aggregate Bonds AGG are limited to short duration and intermediate Treasuries, plus select credit, while long duration, investment grade, and preferred stock lag. Bond leadership concentrates in lower-duration segments and select credit.
Specialty participation favors infrastructure, biotech, and real estate, with 11 of 15 ETFs above their 20D ratio MA vs S&P 500 SPY. Gold GLD crossed below its 20D MA. Silver SLV crossed below both its 20D MA and its 20D ratio MA vs benchmark. Oil, copper, and broad commodity baskets anchor the commodity leader cluster. Commodities split between cyclical baskets and precious-metal weakness.
20-Day Tactical Breadth
Key Takeaways
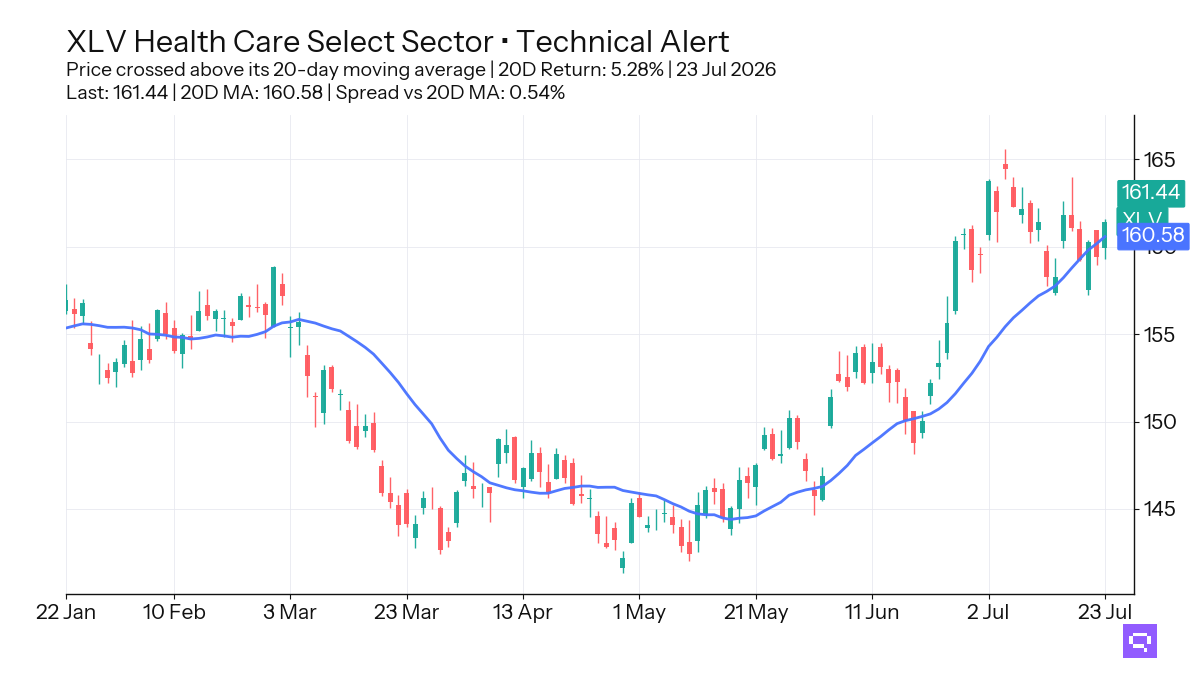
Healthcare XLV, up 5.28% over the trailing 20-day window, crossed above its 20-day moving average. XLV also crossed above its 20D ratio MA vs S&P 500 SPY and sits in the daily, weekly, and monthly relative leader cluster. Healthcare now has price confirmation and benchmark outperformance.
Dividend Growth VIG, Quality Factor QUAL, and Equal Weight S&P 500 RSP crossed above their 20D ratio MA vs S&P 500 SPY. Small-Cap IJR and Mid-Cap VO crossed above their 20D ratio MA vs benchmark even as each sits below its 20D MA. Relative rotation reaches broader U.S. equity exposures ahead of price confirmation.
Infrastructure PAVE crossed above its 20D MA and its 20D ratio MA vs S&P 500 SPY. Preferred Stock PFF crossed below its 20D MA and below its 20-day ratio moving average vs Aggregate Bonds AGG. Cross-asset confirmation concentrates in selected equity groups, while bond leadership is relative and lower-duration.
FEATURED ETF: Health Care Select Sector XLV
Other Technical Signal Events
Equity: Price vs 20-day MA
| Signal | Ticker | Name | 20D perf |
|---|---|---|---|
| Cross-up | XLI | Industrial Select Sector | +0.96% |
| Cross-up | XLV | Health Care Select Sector | +5.28% |
| Cross-down | IQLT | iShares MSCI Intl Quality Factor ETF | +1.82% |
| Cross-down | IVLU | iShares Edge MSCI Intl Value Factor ETF | +1.78% |
| Cross-down | VIG | Vanguard Dividend Appreciation Index ETF | +1.70% |
| Cross-down | JEPI | JPMorgan Equity Premium Income ETF | +1.34% |
| Cross-down | SPYV | S&P 500 Value ETF | +1.30% |
| Cross-down | ACWV | iShares MSCI Global Min Vol Factor ETF | +1.15% |
| Cross-down | SLYV | SPDR S&P 600 Small Cap Value ETF | +1.12% |
| Cross-down | VGK | Vanguard FTSE Europe Index ETF | +1.01% |
| Cross-down | URTH | iShares MSCI World ETF | +0.81% |
| Cross-down | MDYV | SPDR S&P 400 Mid Cap Value ETF | +0.66% |
| Cross-down | EFA | iShares MSCI EAFE ETF | +0.63% |
| Cross-down | VTI | Vanguard Total Stock Market Index ETF | +0.57% |
| Cross-down | VO | Vanguard Mid-Cap Index ETF | +0.57% |
| Cross-down | IMTM | iShares MSCI Intl Momentum Factor ETF | +0.19% |
| Cross-down | VT | Vanguard Total World Stock Index ETF | unch. |
| Cross-down | XLP | Consumer Staples Select Sector | -1.46% |
Equity vs SPY: Price Ratio vs 20-day MA
| Signal | Ticker | Name | 20D rel perf |
|---|---|---|---|
| Cross-up | MDYG | SPDR S&P 400 Mid Cap Growth ETF | -2.16% |
| Cross-up | IJR | iShares Core S&P Small-Cap ETF | -0.35% |
| Cross-up | VO | Vanguard Mid-Cap Index ETF | -0.11% |
| Cross-up | RSP | Invesco S&P 500 Equal Weight ETF | unch. |
| Cross-up | XLI | Industrial Select Sector | +0.28% |
| Cross-up | ACWV | iShares MSCI Global Min Vol Factor ETF | +0.47% |
| Cross-up | QUAL | iShares MSCI USA Quality Factor ETF | +0.64% |
| Cross-up | VIG | Vanguard Dividend Appreciation Index ETF | +1.02% |
| Cross-up | XLV | Health Care Select Sector | +4.57% |
Fixed Income: Price vs 20-day MA
| Signal | Ticker | Name | 20D perf |
|---|---|---|---|
| Cross-down | VTIP | Vanguard Short-Term Inflation-Protected Securities Index ETF | +0.26% |
| Cross-down | PFF | iShares Preferred and Income Securities ETF | -1.30% |
Fixed Income vs AGG: Price Ratio vs 20-day MA
| Signal | Ticker | Name | 20D rel perf |
|---|---|---|---|
| Cross-down | PFF | iShares Preferred and Income Securities ETF | +0.24% |
Specialty: Price vs 20-day MA
| Signal | Ticker | Name | 20D perf |
|---|---|---|---|
| Cross-up | PAVE | Global X U.S. Infrastructure Development ETF | -1.37% |
| Cross-down | GLD | SPDR Gold | +1.53% |
Specialty vs SPY: Price Ratio vs 20-day MA
| Signal | Ticker | Name | 20D rel perf |
|---|---|---|---|
| Cross-up | PAVE | Global X U.S. Infrastructure Development ETF | -2.03% |
| Cross-up | USMV | iShares MSCI USA Min Vol Factor ETF | +0.64% |
| Cross-up | IBB | iShares Biotechnology ETF | +3.41% |
Commodities: Price vs 20-day MA
| Signal | Ticker | Name | 20D perf |
|---|---|---|---|
| Cross-down | SLV | iShares Silver | +0.54% |
Commodities vs SPY: Price Ratio vs 20-day MA
| Signal | Ticker | Name | 20D rel perf |
|---|---|---|---|
| Cross-down | SLV | iShares Silver | -0.13% |
Romain Gandon
CEO, Quantlake
Disclaimer: This article is for informational and educational purposes only and does not constitute investment advice. Past performance is not indicative of future results.