.png)
Tactical Trends: Growth Slips as Defensives and Overseas Lead
Breadth repair reached price and relative measures, led by lower-beta equity
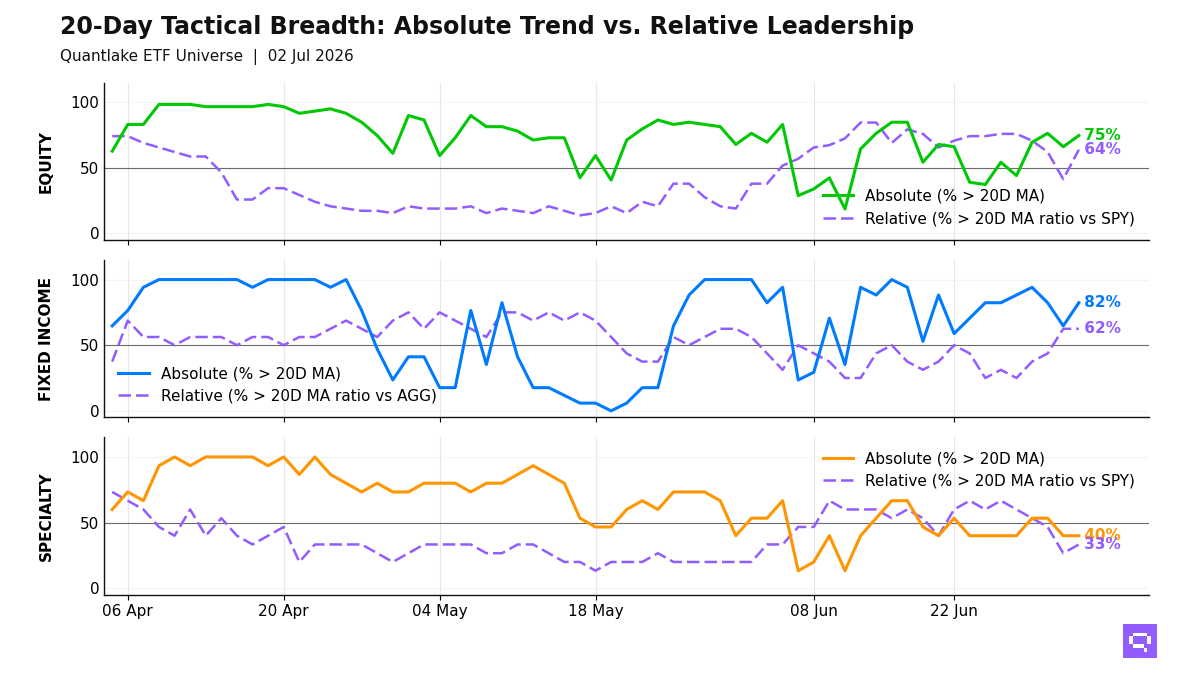
As of July 2, 44 of 59 equity ETFs (75%, +8.5pp) sat above their 20-day moving average (20D MA), and 37 of 58 (64%, +22.4pp) sat above their 20-day ratio moving average vs S&P 500 SPY (20D ratio MA vs SPY). Low-volatility, dividend, value, and developed ex-US exposures drove the move, with Germany EWG and Dividend Quality SCHD crossing higher, while US technology and growth-heavy US equity fell into the laggard group. The equity tape reflects rotation toward lower-beta and overseas leadership.
Fixed income sat with 14 of 17 ETFs (82%, +17.6pp) above their 20D MAs, and the leader list vs Aggregate Bonds AGG concentrated in international aggregate, EM debt, high-yield credit, intermediates, munis, and short duration, with a 20pp price-relative gap. Core aggregate, mortgages, and parts of investment grade recovered in price without relative leadership. Long duration, preferreds, and inflation-linked debt lagged both ways. The bond move marks a broad price rebound with leadership concentrated away from long-duration rate sensitivity.
Specialty breadth held at 6 of 15 above the 20D MA, and relative leaders vs S&P 500 SPY sat in biotech, REITs, international real estate, low volatility, and Ethereum Trust ETHA, while clean energy, momentum, semiconductors, covered-call tech, and long/short equity lagged. Commodity exposures added no repair, with oil, broad commodities, copper, and silver in the relative laggard cluster and silver below its 20D MA. The specialty and commodity mix is selective, with strength concentrated in biotech, real estate, low volatility, and Ethereum-linked exposure.
20-Day Tactical Breadth
Key Takeaways
Cross-timescale equity alignment reached 71%, with daily, weekly, and monthly relative leaders clustered in value, dividend, small-cap, equal-weight, industrials, healthcare, and quality groups. China, momentum, energy, and copper-linked equity sat in the opposing cluster. The multi-horizon equity structure centers on balanced and lower-beta leadership.
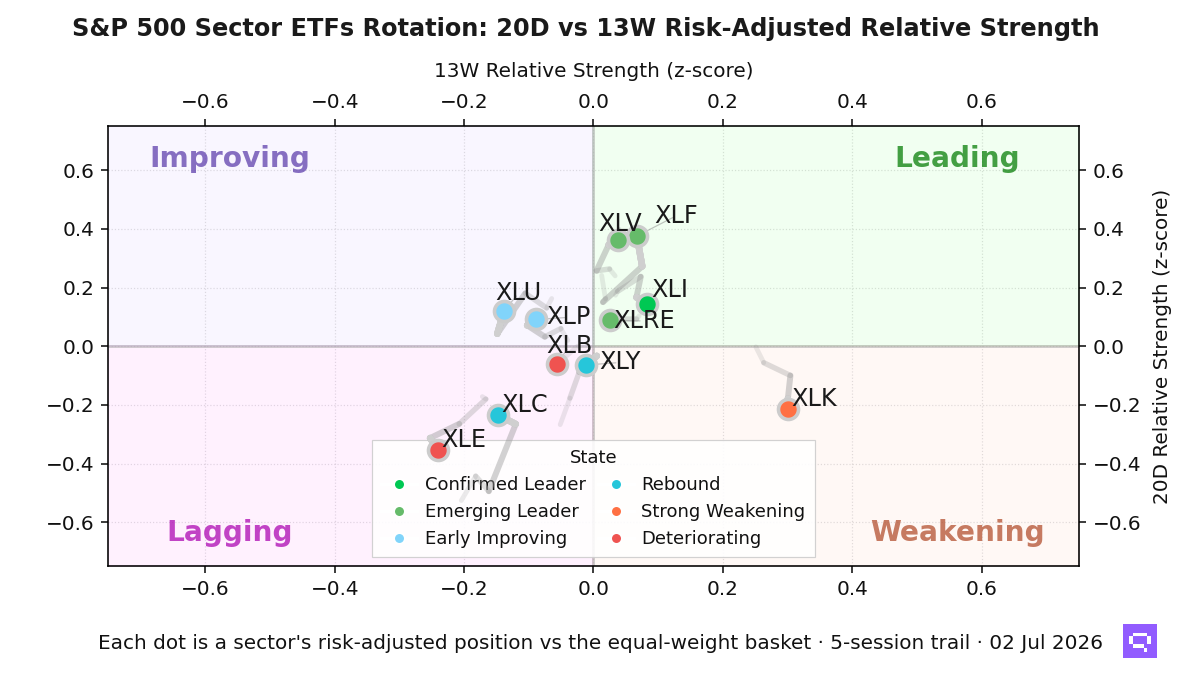
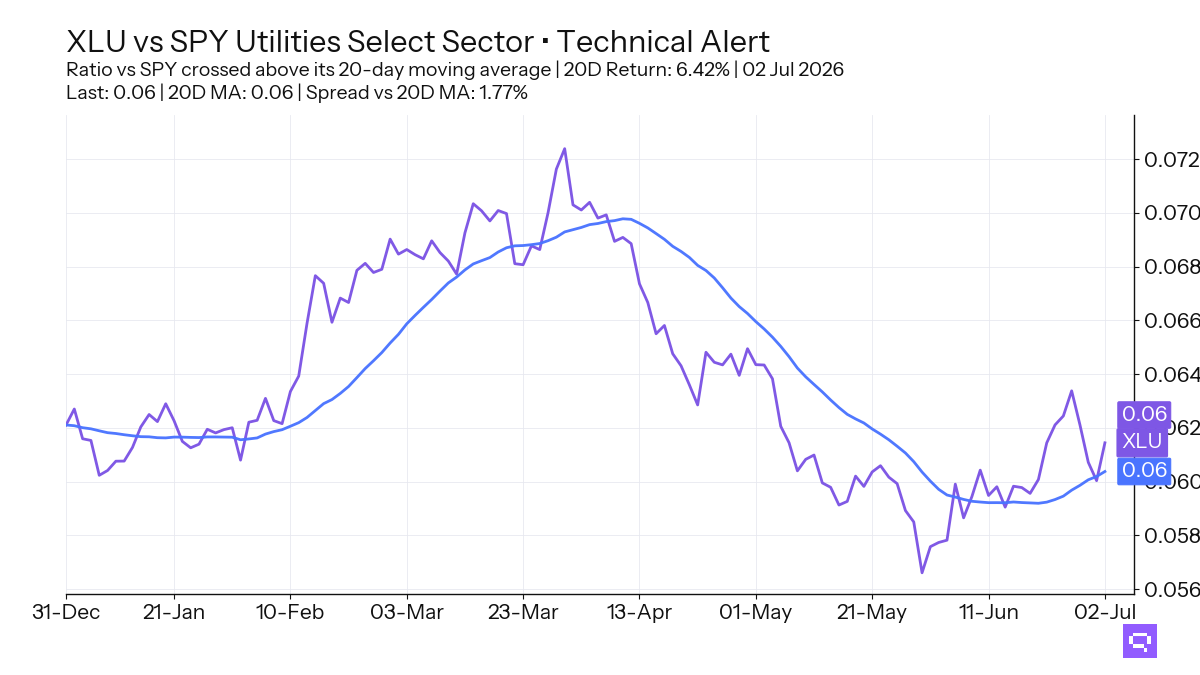
Utilities XLU, up 6.42% relative to SPY over the period, crossed above its 20-day ratio moving average vs SPY (20D ratio MA vs SPY). Consumer Staples XLP and Real Estate XLRE also crossed above their 20D ratio MAs vs benchmark. The US sector relative-strength repair concentrates in defensive income and rate-sensitive groups.
Cross-timescale fixed-income alignment reached 65%, with international aggregate, EM debt, high-yield credit, munis, investment grade, and short duration leading across horizons, while long duration, inflation-linked debt, and preferreds lagged. The fixed-income profile concentrates participation in credit and intermediate duration.
FEATURED ETF: Utilities Select Sector XLU vs SPY
Other Technical Signal Events
EQUITY
↗ Price breakouts (cross-up 20D MA)
VEA - Vanguard FTSE Developed Markets Index ETF · 20D perf: -0.68%
VYM - Vanguard High Dividend Yield Index ETF · unch.
IVLU - iShares Edge MSCI Intl Value Factor ETF · +0.40%
SCHD - Schwab U.S. Dividend Equity ETF · +0.86%
EWG - iShares MSCI Germany ETF · +0.91%
XLB - Materials Select Sector · +1.11%
EFAV - iShares MSCI EAFE Min Vol Factor ETF · +1.29%
XLRE - The Real Estate Select Sector · +3.59%
XLP - Consumer Staples Select Sector · +4.17%
↘ Price breakdowns (cross-down 20D MA)
SPYG - S&P 500 Growth ETF · 20D perf: -3.19%
QQQ - Invesco QQQ · -4.14%
IWF - iShares Russell 1000 Growth ETF · -4.24%
IYW - iShares U.S. Technology ETF · -5.44%
↗ Leadership gains (cross-up 20D MA vs SPY)
URTH - iShares MSCI World ETF · 20D relative perf: +0.69%
VYM - Vanguard High Dividend Yield Index ETF · +1.00%
EWZ - iShares MSCI Brazil ETF · +1.35%
IVLU - iShares Edge MSCI Intl Value Factor ETF · +1.42%
SCHD - Schwab U.S. Dividend Equity ETF · +1.88%
EWG - iShares MSCI Germany ETF · +1.93%
XLB - Materials Select Sector · +2.14%
EFAV - iShares MSCI EAFE Min Vol Factor ETF · +2.31%
ACWV - iShares MSCI Global Min Vol Factor ETF · +2.32%
SPYV - S&P 500 Value ETF · +2.83%
EFA - iShares MSCI EAFE ETF · +2.85%
IQLT - iShares MSCI Intl Quality Factor ETF · +4.05%
VGK - Vanguard FTSE Europe Index ETF · +4.07%
EWU - iShares MSCI United Kingdom ETF · +4.09%
XLRE - The Real Estate Select Sector · +4.63%
XLP - Consumer Staples Select Sector · +5.22%
XLU - Utilities Select Sector · +6.42%
↘ Leadership losses (cross-down 20D MA vs SPY)
MDYG - SPDR S&P 400 Mid Cap Growth ETF · 20D relative perf: +1.07%
EWT - iShares MSCI Taiwan ETF · -0.92%
SPYG - S&P 500 Growth ETF · -2.21%
IYW - iShares U.S. Technology ETF · -4.48%
FIXED INCOME
↗ Price breakouts (cross-up 20D MA)
VTIP - Vanguard Short-Term Inflation-Protected Securities Index ETF · 20D perf: -0.38%
LQD - iShares iBoxx $ Investment Grade Corporate Bond ETF · +0.37%
MBB - iShares MBS ETF · +0.38%
↘ Price breakdowns (cross-down 20D MA)
None on the close
↗ Leadership gains (cross-up 20D MA vs AGG)
None on the close
↘ Leadership losses (cross-down 20D MA vs AGG)
None on the close
SPECIALTY
↗ Price breakouts (cross-up 20D MA)
ETHA - iShares Ethereum Trust ETF · 20D perf: -5.30%
FTLS - First Trust Long/Short Equity ETF · -0.81%
↘ Price breakdowns (cross-down 20D MA)
JEPQ - JPMorgan Nasdaq Equity Premium Income ETF · 20D perf: -1.30%
MTUM - iShares MSCI USA Momentum Factor ETF · -3.83%
↗ Leadership gains (cross-up 20D MA vs SPY)
ETHA - iShares Ethereum Trust ETF · 20D relative perf: -4.35%
VNQ - Vanguard Real Estate Index ETF · +5.80%
↘ Leadership losses (cross-down 20D MA vs SPY)
JEPQ - JPMorgan Nasdaq Equity Premium Income ETF · 20D relative perf: -0.30%
COMMODITIES
No event on the close
Romain Gandon
CEO, Quantlake
Disclaimer: This article is for informational and educational purposes only and does not constitute investment advice. Past performance is not indicative of future results.