.png)

Tactical Trends: Growth and Global Equity Reclaim Relative Leadership
International and growth groups gain ground as yield groups fade
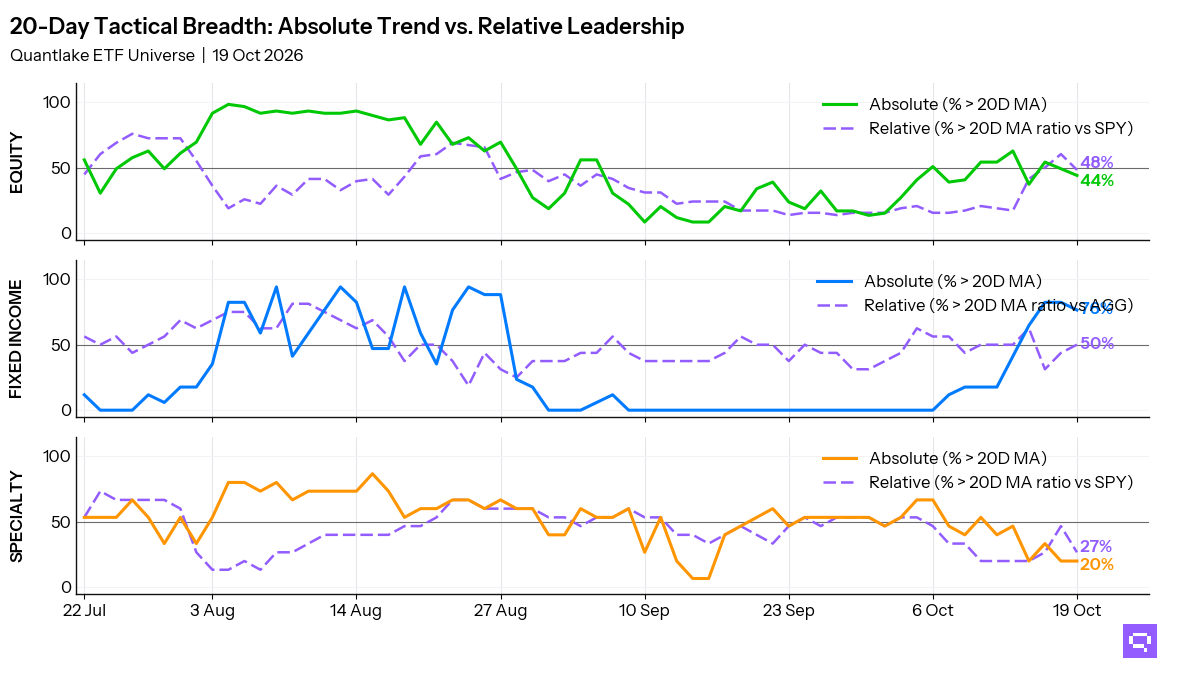
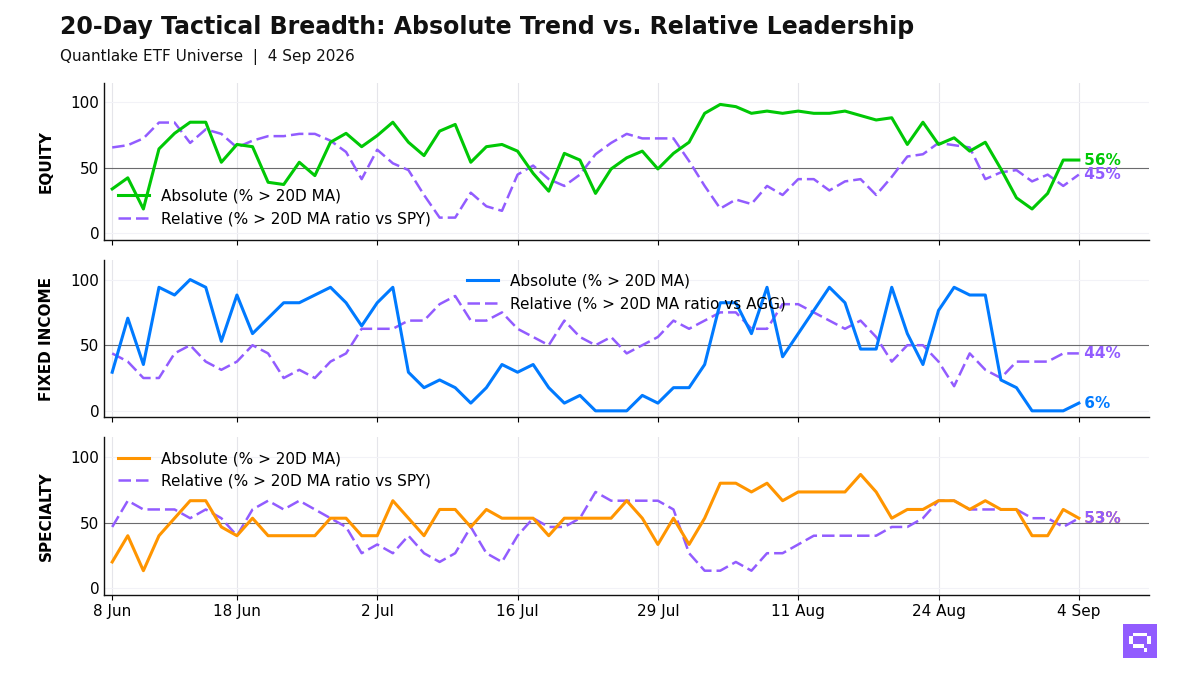
Relative leadership favors growth and global equity across our ETF universe at the September 4 close, with 33 of 59 ETFs (56%, unchanged on the day) above their 20-day moving average (20D MA) and 26 of 58 (45%, +8.6pp) above their ratio MA vs the S&P 500 SPY. Nasdaq 100 QQQ and China Large Cap FXI crossed above their 20D MAs. Relative winners clustered in developed ex-US, Asia, and growth, while dividend and value cohorts lost ground vs the benchmark. The 11pp price-relative gap shows price participation ahead of benchmark-relative leadership.
Fixed income participation is limited to Long Treasuries TLT on an absolute basis, and 7 of 16 ETFs outperform the Aggregate Bonds AGG on a relative basis, led by credit, inflation-linked debt, and short duration, while core Treasuries and investment grade lag the benchmark. The bond cross-section is selective. The split runs between a rate-sensitive price rebound and lower-volatility relative stability.
Specialty leadership holds in Semiconductors SMH alongside alternative and biotech strength vs the S&P 500 SPY, while real estate, clean energy, and min-volatility lag. Commodity signals split between Gold GLD below its 20D MA and firmer copper and broad commodity leadership vs the S&P 500 SPY. Specialty and commodities point to selective cyclical strength rather than a unified hard-asset bid.
20-Day Tactical Breadth
Key Takeaways
Asia-Pacific equity and US technology hold relative leadership vs the S&P 500 SPY across daily, weekly, and monthly horizons, and cross-timescale equity alignment stands at 54%. Dividend, equal-weight, and quality cohorts fill the laggard cluster on the same basis. Multi-horizon equity leadership concentrates in growth and Asia exposures.
Long Treasuries TLT crossed above its 20D MA even as relative leaders vs Aggregate Bonds AGG cluster in credit, inflation-linked debt, and short duration across horizons. Core Treasuries and investment grade fill the laggard cluster on the same basis. The bond split favors lower-volatility outperformance more than a broad duration recovery.
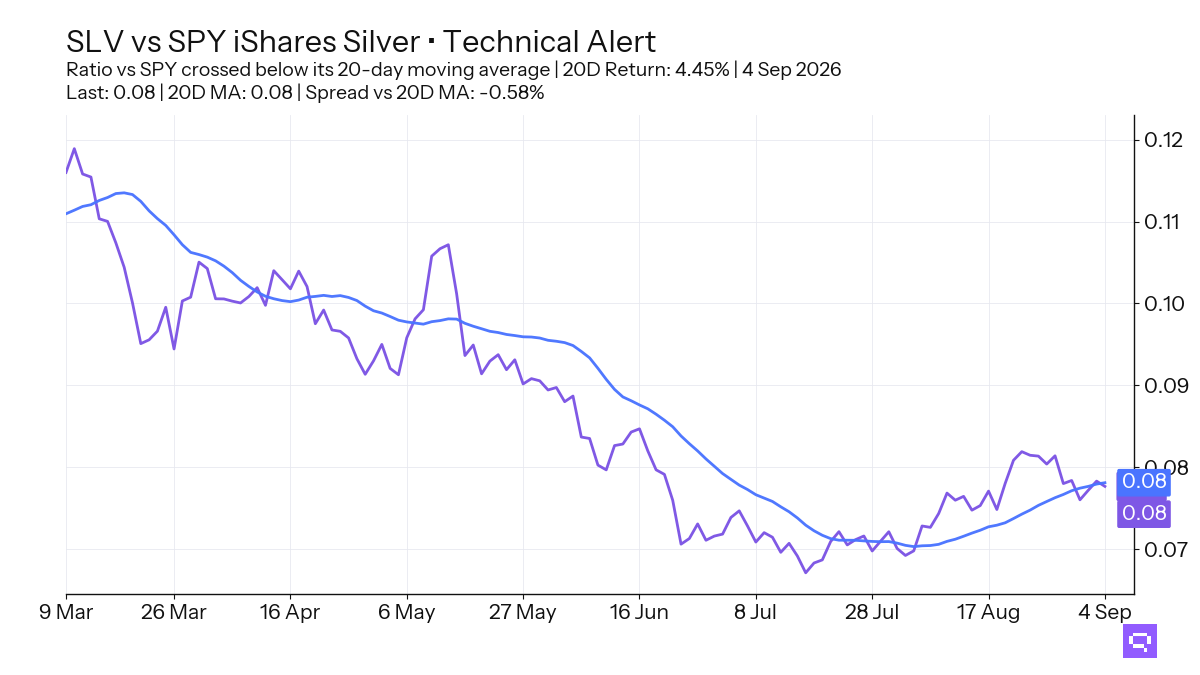
Silver SLV, up 4.03% over the trailing 20-day window, crossed below its 20D MA. Semiconductors SMH crossed above both its 20D MA and its ratio MA vs the S&P 500 SPY, while Min Volatility USMV crossed below both its 20D MA and its ratio MA vs the S&P 500 SPY after a 0.18% 20-day price gain and a 0.58% relative gain. Specialty and commodity leadership rotated away from precious metals and low-volatility exposure toward cyclical beta and alternatives.
FEATURED ETF: iShares Silver SLV
Other Technical Signal Events
Equity: Price vs 20-day MA
| Signal | Ticker | Name | 20D perf |
|---|---|---|---|
| Cross-up | FXI | iShares China Large-Cap ETF | -0.80% |
| Cross-up | QQQ | Invesco QQQ | -0.56% |
| Cross-down | COPX | Global X Copper Miners ETF | +2.99% |
| Cross-down | SPYV | S&P 500 Value ETF | +0.48% |
Equity vs SPY: Price Ratio vs 20-day MA
| Signal | Ticker | Name | 20D rel perf |
|---|---|---|---|
| Cross-up | SPYG | S&P 500 Growth ETF | -0.68% |
| Cross-up | IWF | iShares Russell 1000 Growth ETF | -0.56% |
| Cross-up | INDA | iShares MSCI India ETF | -0.52% |
| Cross-up | FXI | iShares China Large-Cap ETF | -0.41% |
| Cross-up | QQQ | Invesco QQQ | -0.17% |
| Cross-up | XLK | Technology Select Sector | unch. |
| Cross-up | URTH | iShares MSCI World ETF | unch. |
| Cross-up | EFA | iShares MSCI EAFE ETF | +0.21% |
| Cross-up | VT | Vanguard Total World Stock Index ETF | +0.67% |
| Cross-up | VEA | Vanguard FTSE Developed Markets Index ETF | +1.60% |
| Cross-down | XLV | Health Care Select Sector | +3.90% |
| Cross-down | COPX | Global X Copper Miners ETF | +3.40% |
| Cross-down | SCHD | Schwab U.S. Dividend Equity ETF | +3.06% |
| Cross-down | DVY | iShares Select Dividend ETF | +1.85% |
| Cross-down | SPYV | S&P 500 Value ETF | +0.88% |
Fixed Income: Price vs 20-day MA
| Signal | Ticker | Name | 20D perf |
|---|---|---|---|
| Cross-up | TLT | iShares 20+ Year Treasury Bond ETF | -0.28% |
Specialty: Price vs 20-day MA
| Signal | Ticker | Name | 20D perf |
|---|---|---|---|
| Cross-up | SMH | VanEck Semiconductor ETF | -2.69% |
| Cross-down | GLD | SPDR Gold | +2.08% |
| Cross-down | USMV | iShares MSCI USA Min Vol Factor ETF | +0.18% |
Specialty vs SPY: Price Ratio vs 20-day MA
| Signal | Ticker | Name | 20D rel perf |
|---|---|---|---|
| Cross-up | SMH | VanEck Semiconductor ETF | -2.30% |
| Cross-up | DBMF | iMGP DBi Managed Futures Strategy ETF | +2.05% |
| Cross-down | USMV | iShares MSCI USA Min Vol Factor ETF | +0.58% |
Commodities: Price vs 20-day MA
| Signal | Ticker | Name | 20D perf |
|---|---|---|---|
| Cross-down | SLV | iShares Silver | +4.03% |
Commodities vs SPY: Price Ratio vs 20-day MA
| Signal | Ticker | Name | 20D rel perf |
|---|---|---|---|
| Cross-up | CPER | United States Copper LP | +0.52% |
| Cross-down | SLV | iShares Silver | +4.45% |
Romain Gandon
CEO, Quantlake
Disclaimer: This article is for informational and educational purposes only and does not constitute investment advice. Past performance is not indicative of future results.