.png)
Tactical Trends: Equity Repair Rotates Overseas, US Growth Lags
Price recovered faster than SPY-relative leadership
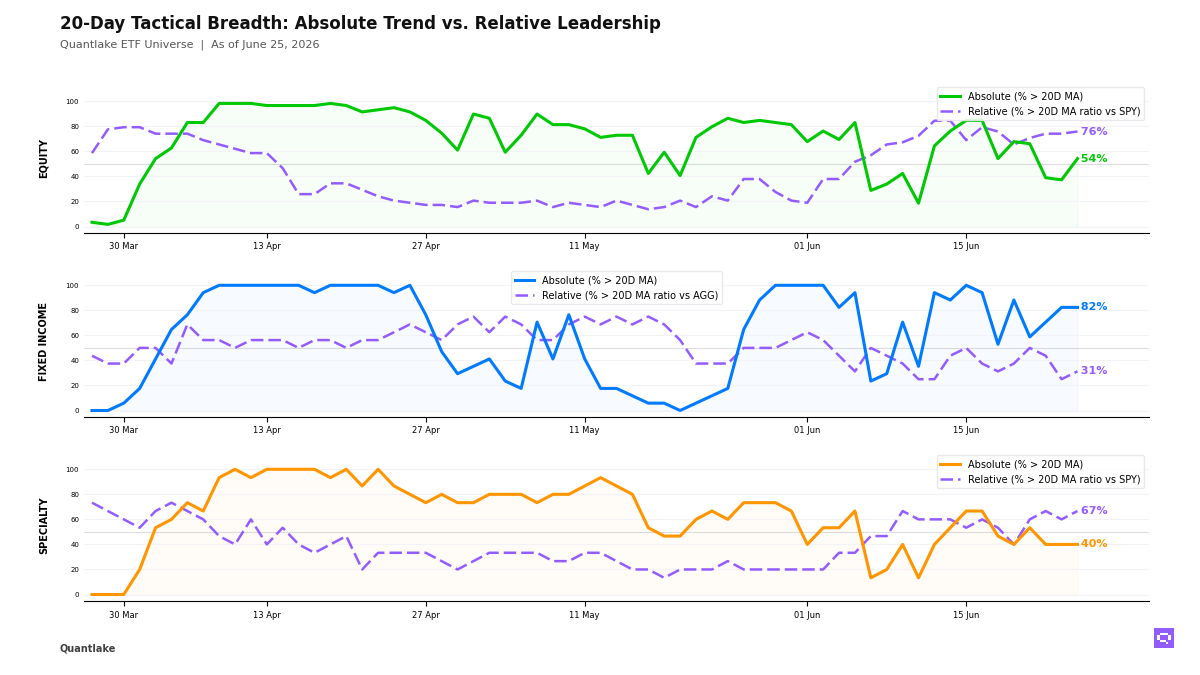
As of June 25, 32 of 59 equity ETFs (54%, +17.0pp) in our ETF universe sit above their 20-day moving average (20D MA), while 44 of 58 (76%, +1.7pp) sit above their 20-day ratio moving average vs S&P 500 SPY (20D ratio MA vs SPY). The 54% price reading centers on developed ex-US, Asia-Pacific, Taiwan, South Korea, and US dividend and value exposures, and the 76% relative reading places low-volatility and selective ex-US names ahead of the benchmark while US growth, China, Germany, technology, energy, and discretionary sit in the laggard group. The 22pp price-relative gap defines a split equity regime: price repaired across more of the list, and benchmark leadership sits in defensive and ex-US exposures.
Fixed income is benchmark-led, with 5 of 16 above their 20-day ratio moving average vs Aggregate Bonds AGG (20D ratio MA vs AGG). Long duration, mortgage-backed securities, investment grade, and international aggregate outpace the benchmark, while high yield, EM debt, munis, and short duration lag it. The fixed-income mix is a rate-sensitive rebound with limited credit confirmation.
Specialty puts 10 of 15 ETFs ahead of the S&P 500 SPY on relative measures, led by biotech, infrastructure, real estate, semiconductors, and momentum, while gold, miners, bitcoin, ether, and clean energy lag the benchmark. Agriculture Basket DBA crossed above its 20D MA. Silver and copper sit in the commodity laggard list. The specialty and commodity mix is selective, with real-asset repair concentrated in agriculture and equity-linked specialty leadership.
20-Day Tactical Breadth
Key Takeaways
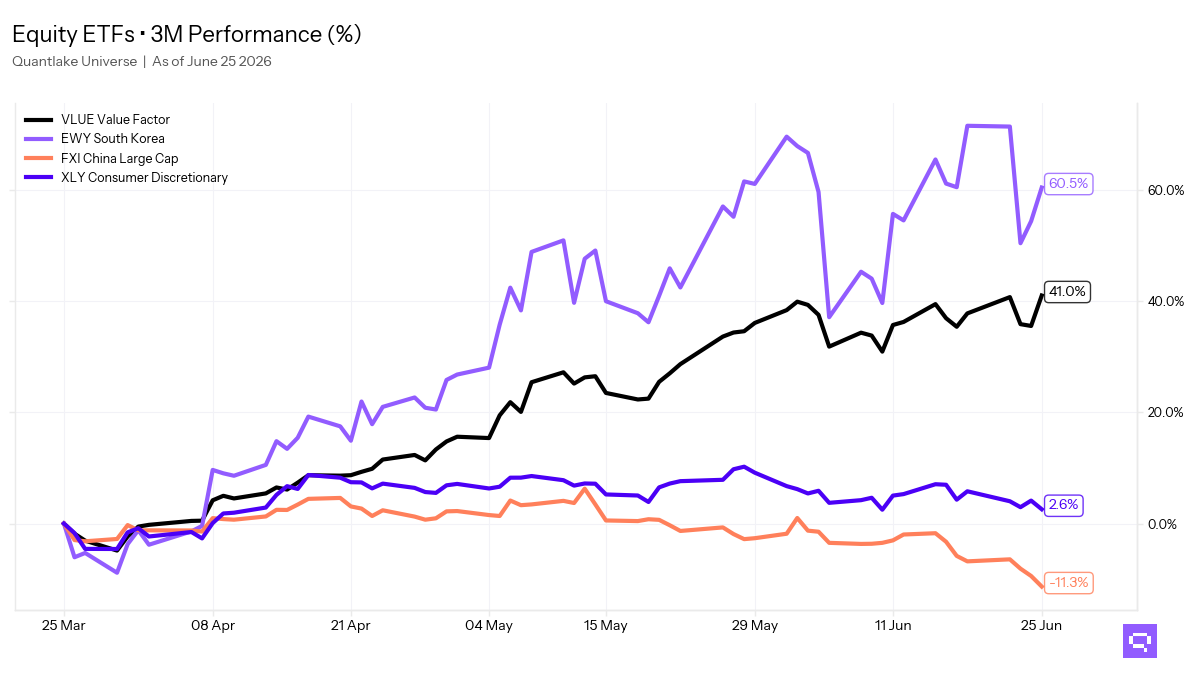
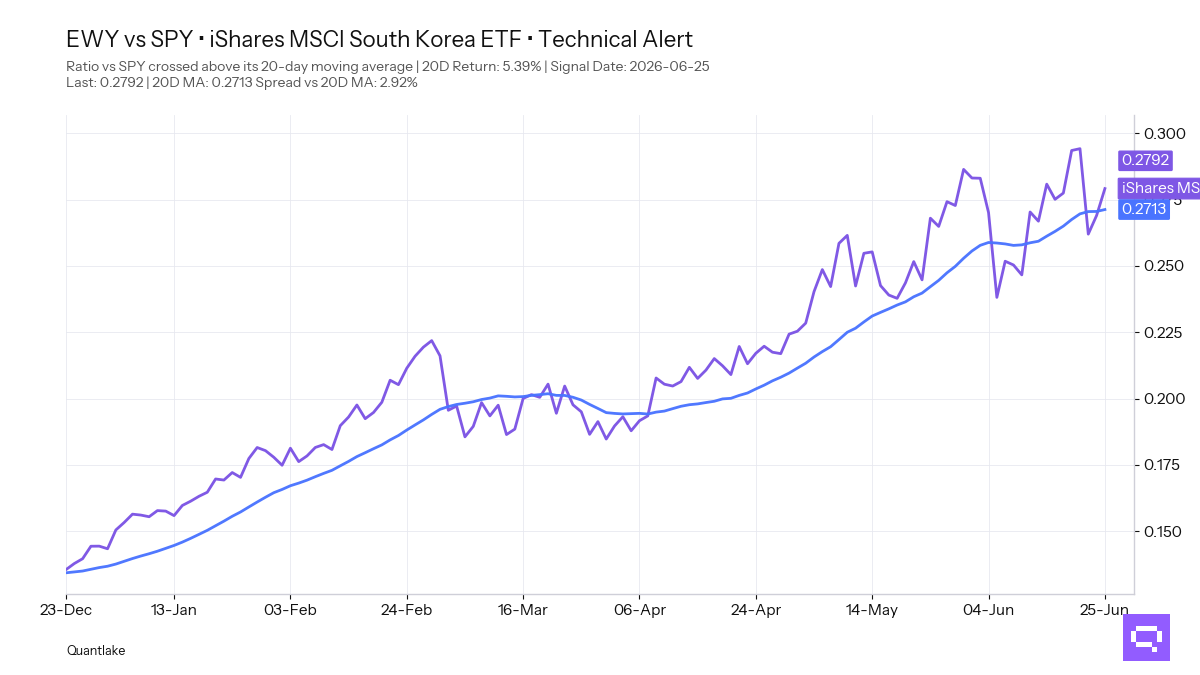
South Korea EWY rose 3.38% over the period and crossed above its 20-day moving average. Its ratio versus the S&P 500 SPY also crossed above its 20-day ratio moving average versus SPY. South Korea sits in the daily, weekly, and monthly relative leader group. EWY sits in a confirmed Asia-Pacific leadership cluster with Japan and Taiwan.
Mortgage-Backed MBB crossed above its 20-day ratio moving average versus Aggregate Bonds AGG. Fixed-income alignment reached 88%. Relative winners center on long duration, MBS, investment grade, and international aggregate, while high yield and EM debt sit in the laggard group. The bond leaderboard favors rate sensitivity over credit beta.
Managed Futures DBMF crossed above its 20-day ratio moving average versus S&P 500 SPY even as it sits below its 20-day moving average. Agriculture Basket DBA crossed above its 20-day moving average. Silver and copper sit in the commodity laggard list. The diversification sleeve is stabilizing in relative terms faster than it is in price.
FEATURED ETF: iShares MSCI South Korea ETF EWY
Other Technical Signal Events
EQUITY
↗ Price breakouts (cross-up 20D MA)
VGK - Vanguard FTSE Europe Index ETF · 20D perf: -0.33%
EFA - iShares MSCI EAFE ETF · unch.
VEA - Vanguard FTSE Developed Markets Index ETF · +0.17%
IQLT - iShares MSCI Intl Quality Factor ETF · +0.39%
VIG - Vanguard Dividend Appreciation Index ETF · +0.91%
VYM - Vanguard High Dividend Yield Index ETF · +0.99%
IMTM - iShares MSCI Intl Momentum Factor ETF · +1.52%
EWJ - iShares MSCI Japan ETF · +1.74%
EWY - iShares MSCI South Korea ETF · +3.38%
VLUE - iShares MSCI USA Value Factor ETF · +4.96%
↘ Price breakdowns (cross-down 20D MA)
None on the close
↗ Leadership gains (cross-up 20D MA vs SPY)
EWZ - iShares MSCI Brazil ETF · 20D relative perf: -2.59%
EWY - iShares MSCI South Korea ETF · +5.39%
↘ Leadership losses (cross-down 20D MA vs SPY)
VWO - Vanguard FTSE Emerging Markets Index ETF · 20D relative perf: -0.46%
FIXED INCOME
↗ Price breakouts (cross-up 20D MA)
None on the close
↘ Price breakdowns (cross-down 20D MA)
None on the close
↗ Leadership gains (cross-up 20D MA vs AGG)
MBB - iShares MBS ETF · 20D relative perf: +0.13%
↘ Leadership losses (cross-down 20D MA vs AGG)
None on the close
SPECIALTY
↗ Price breakouts (cross-up 20D MA)
None on the close
↘ Price breakdowns (cross-down 20D MA)
None on the close
↗ Leadership gains (cross-up 20D MA vs SPY)
DBMF - iMGP DBi Managed Futures Strategy ETF · 20D relative perf: +0.33%
↘ Leadership losses (cross-down 20D MA vs SPY)
None on the close
COMMODITIES
↗ Price breakouts (cross-up 20D MA)
DBA - Invesco DB Agriculture · 20D perf: -2.00%
↘ Price breakdowns (cross-down 20D MA)
None on the close
↗ Leadership gains (cross-up 20D MA vs SPY)
None on the close
↘ Leadership losses (cross-down 20D MA vs SPY)
None on the close
Romain Gandon
CEO, Quantlake
Disclaimer: This article is for informational and educational purposes only and does not constitute investment advice. Past performance is not indicative of future results.