.png)

Tactical Trends: Equity Leadership Contracts Under Broad Price Support
A 62pp price-relative gap keeps outperformance narrowly concentrated.
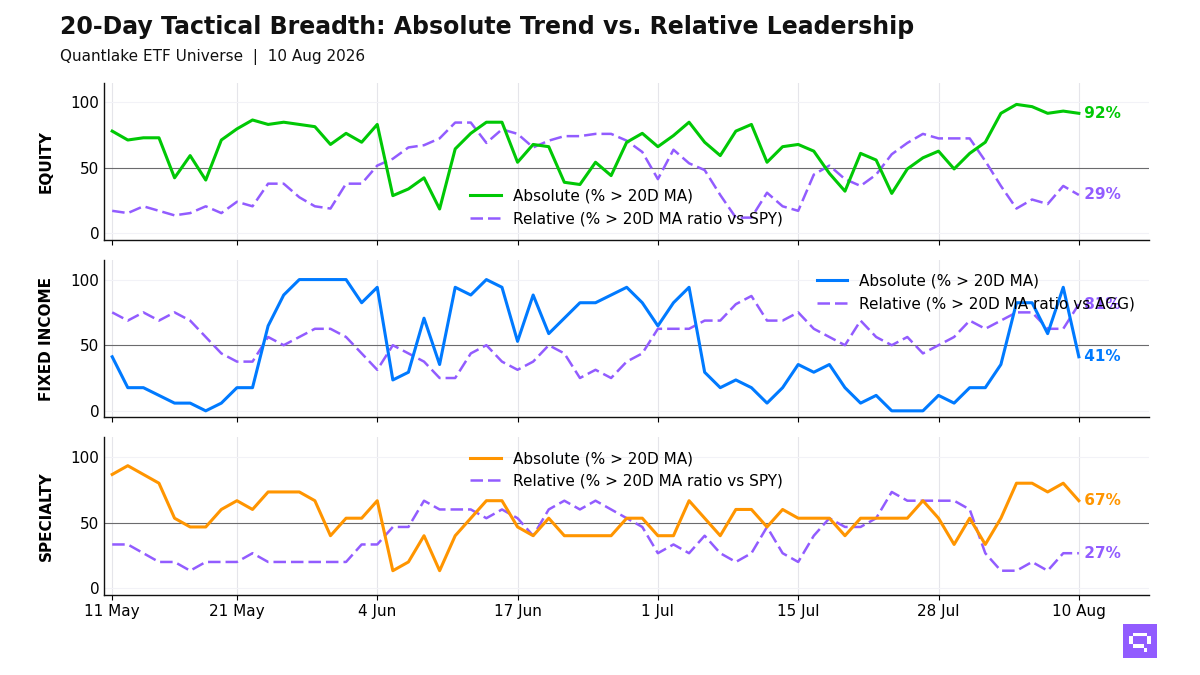
Equity leadership contracted at the close on August 10, with 54 of 59 ETFs (92%, -1.7pp) above their 20-day moving average (20D MA) and only 17 of 58 (29%, -6.9pp) above their 20-day ratio moving average vs S&P 500 SPY (20D ratio MA vs SPY), a 62pp price-relative gap. Price participation spans low-volatility, developed ex-US, and country exposures. Relative winners narrow to energy and select Asia and China, while low-volatility, developed ex-US, and small-cap US names fill the price-recovery bucket. The equity setup resembles broad price participation with outperformance concentrated in a narrow subset.
High-yield, EM debt, preferreds, and short-duration inflation protection lead vs Aggregate Bonds AGG, with 13 of 16 above their 20D ratio MA vs the benchmark. Treasuries and long investment grade lag in both price and relative terms. Bond leadership favors credit and shorter duration, and rate sensitivity limits absolute participation.
Specialty leadership is limited to precious metals, biotech, and min-vol vs S&P 500 SPY, while crypto, clean energy, and equity-adjacent growth lag; 10 of 15 hold above their 20D MA. Commodities add a separate hard-asset pocket, with oil, broad commodities, and agriculture above their 20D MA. The non-core cross-section splits between hard-asset strength and equity-adjacent weakness.
20-Day Tactical Breadth
Key Takeaways
Cross-timescale equity alignment is 86%, with energy, growth, and global miners aligned on the relative upside, while dividend and value, emerging markets, and defensives dominate the aligned laggard cluster. Multi-horizon leadership concentrates in cyclical beta and leaves broad recovery themes without relative confirmation.
Muni Bonds MUB, TIPS TIP, and Short TIPS VTIP crossed above their 20D ratio MA versus Aggregate Bonds AGG, and 7-10yr Treasuries IEF and Investment Grade Credit LQD lag the benchmark. Relative bond leadership favors spread and shorter-duration segments, and long-rate exposure does not confirm the move.
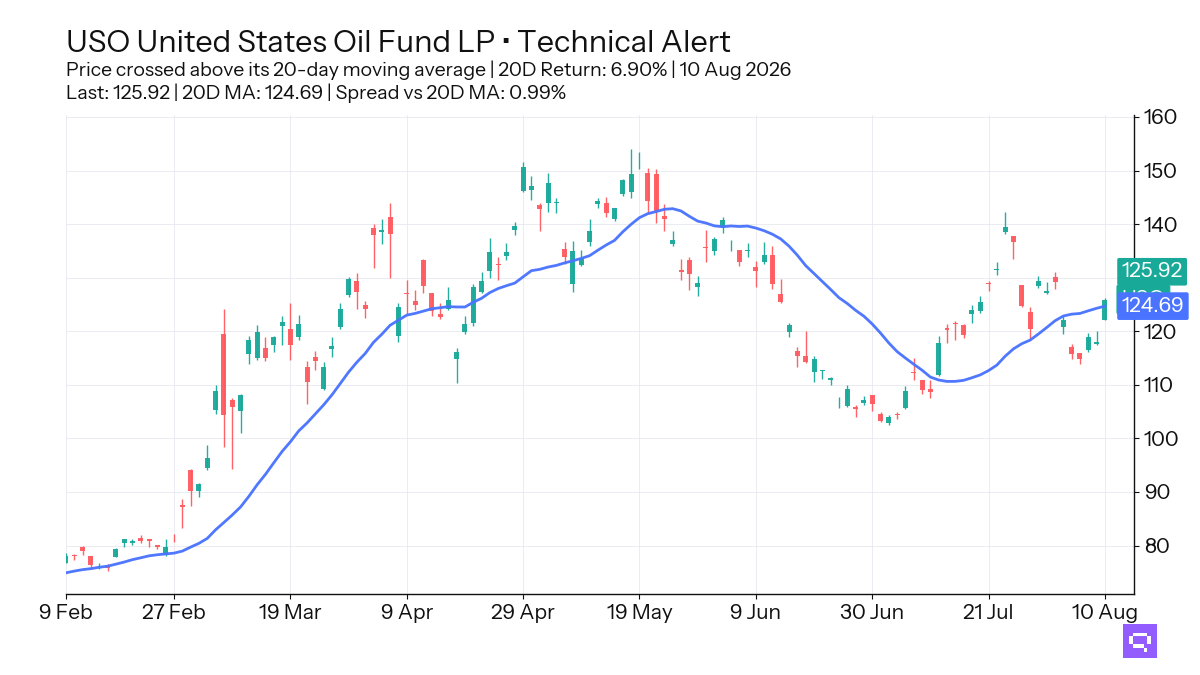
Oil USO, up 6.90% over the trailing 20-day window, crossed above its 20-day moving average. Broad Commodities PDBC and Agriculture Basket DBA also crossed above their 20D MA. Commodity strength concentrates in energy and broad baskets, and hard assets form a separate absolute strength pocket outside equities.
FEATURED ETF: United States Oil Fund LP USO
Other Technical Signal Events
Equity: Price vs 20-day MA
| Signal | Ticker | Name | 20D perf |
|---|---|---|---|
| Cross-up | XLE | Energy Select Sector | +6.06% |
| Cross-down | XLP | Consumer Staples Select Sector | +0.43% |
| Cross-down | EWY | iShares MSCI South Korea ETF | -2.92% |
Equity vs SPY: Price Ratio vs 20-day MA
| Signal | Ticker | Name | 20D rel perf |
|---|---|---|---|
| Cross-up | XLV | Health Care Select Sector | +1.13% |
| Cross-up | XLE | Energy Select Sector | +2.79% |
| Cross-up | FXI | iShares China Large-Cap ETF | +5.75% |
| Cross-down | VGK | Vanguard FTSE Europe Index ETF | +1.77% |
| Cross-down | IVLU | iShares Edge MSCI Intl Value Factor ETF | +1.42% |
| Cross-down | EFA | iShares MSCI EAFE ETF | +1.39% |
| Cross-down | VEA | Vanguard FTSE Developed Markets Index ETF | +0.72% |
| Cross-down | URTH | iShares MSCI World ETF | +0.30% |
| Cross-down | VT | Vanguard Total World Stock Index ETF | +0.12% |
| Cross-down | QQQ | Invesco QQQ | -1.84% |
Fixed Income: Price vs 20-day MA
| Signal | Ticker | Name | 20D perf |
|---|---|---|---|
| Cross-down | IEI | iShares 3-7 Year Treasury Bond ETF | +0.15% |
| Cross-down | VGIT | Vanguard Intermediate-Term Treasury Index ETF | unch. |
| Cross-down | BNDX | Vanguard Total International Bond Index ETF | unch. |
| Cross-down | MBB | iShares MBS ETF | unch. |
| Cross-down | VCIT | Vanguard Intermediate-Term Corporate Bond Index ETF | unch. |
| Cross-down | IEF | iShares 7-10 Year Treasury Bond ETF | -0.23% |
| Cross-down | TIP | iShares TIPS Bond ETF | -0.25% |
| Cross-down | LQD | iShares iBoxx $ Investment Grade Corporate Bond ETF | -0.51% |
Fixed Income vs AGG: Price Ratio vs 20-day MA
| Signal | Ticker | Name | 20D rel perf |
|---|---|---|---|
| Cross-up | MUB | iShares National Muni Bond ETF | -0.58% |
| Cross-up | TIP | iShares TIPS Bond ETF | -0.11% |
| Cross-up | VTIP | Vanguard Short-Term Inflation-Protected Securities Index ETF | +0.28% |
Specialty: Price vs 20-day MA
| Signal | Ticker | Name | 20D perf |
|---|---|---|---|
| Cross-up | DBMF | iMGP DBi Managed Futures Strategy ETF | +1.06% |
| Cross-down | ETHA | iShares Ethereum Trust ETF | +5.76% |
| Cross-down | IBIT | iShares Bitcoin | +2.87% |
| Cross-down | ICLN | iShares Global Clean Energy ETF | -2.95% |
Specialty vs SPY: Price Ratio vs 20-day MA
| Signal | Ticker | Name | 20D rel perf |
|---|---|---|---|
| Cross-up | USMV | iShares MSCI USA Min Vol Factor ETF | -0.10% |
| Cross-down | SMH | VanEck Semiconductor ETF | -5.77% |
Commodities: Price vs 20-day MA
| Signal | Ticker | Name | 20D perf |
|---|---|---|---|
| Cross-up | DBA | Invesco DB Agriculture | +0.36% |
| Cross-up | PDBC | Invesco Optimum Yield Diversified Commodity Strategy No K-1 ETF | +5.50% |
| Cross-up | USO | United States Oil Fund LP | +6.90% |
Romain Gandon
CEO, Quantlake
Disclaimer: This article is for informational and educational purposes only and does not constitute investment advice. Past performance is not indicative of future results.