.png)
Tactical Trends: Equity Leadership Narrows to Domestic Pockets
Domestic winners lead while global beta breaks lower
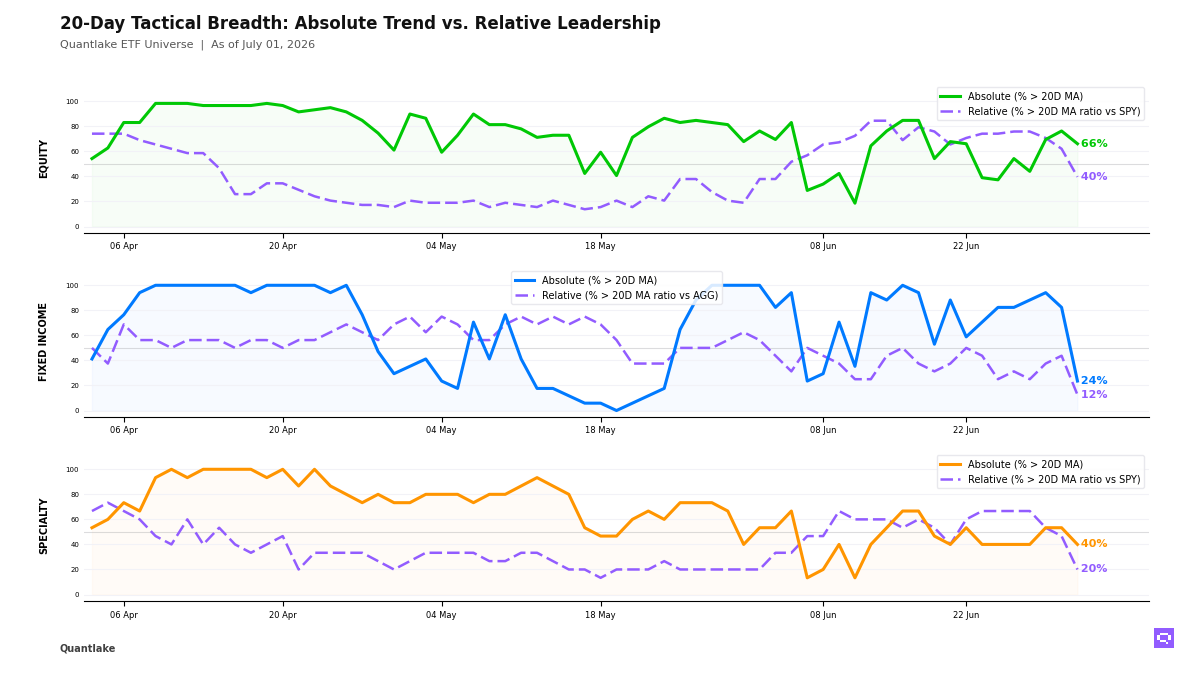
As of July 1, 39 of 59 equity ETFs (66%, -10.2pp) sit above their 20-day moving average (20D MA), while 23 of 58 (40%, -22.4pp) hold above their 20-day ratio moving average vs S&P 500 SPY (20D ratio MA vs SPY), a 26pp price-relative gap. US dividend, equal-weight, small-cap, and Taiwan equity hold the relative lead. Emerging markets, developed ex-US, low-volatility, and technology lost ground, and Technology XLK crossed below both its 20D MA and 20D ratio MA vs SPY. Equity participation is now a price recovery, with leadership concentrated in domestic pockets.
Fixed income broke lower across duration and credit, with only 4 of 17 bond ETFs (24%, -58.8pp) above their 20D MA and only muni broad and short-duration credit outperforming the Aggregate Bonds AGG. 7-10yr Treasuries IEF and Long Treasuries TLT joined high yield, investment grade, EM debt, mortgages, and inflation-linked exposure in the lagging group. The bond tape is a broad decline. Relative strength is limited to short duration and munis.
Specialty breadth weakened around semiconductors, crypto-linked exposure, gold, and infrastructure, while biotech, low-volatility, and global real estate outperformed the S&P 500 SPY. Agriculture Basket DBA crossed above its 20D ratio MA vs S&P 500 SPY, and oil, broad commodities, copper, and silver occupy the lagging cross-timescale set. Specialty and commodities now offer isolated relative winners in biotech, low-volatility, real estate, and agriculture.
20-Day Tactical Breadth
Key Takeaways
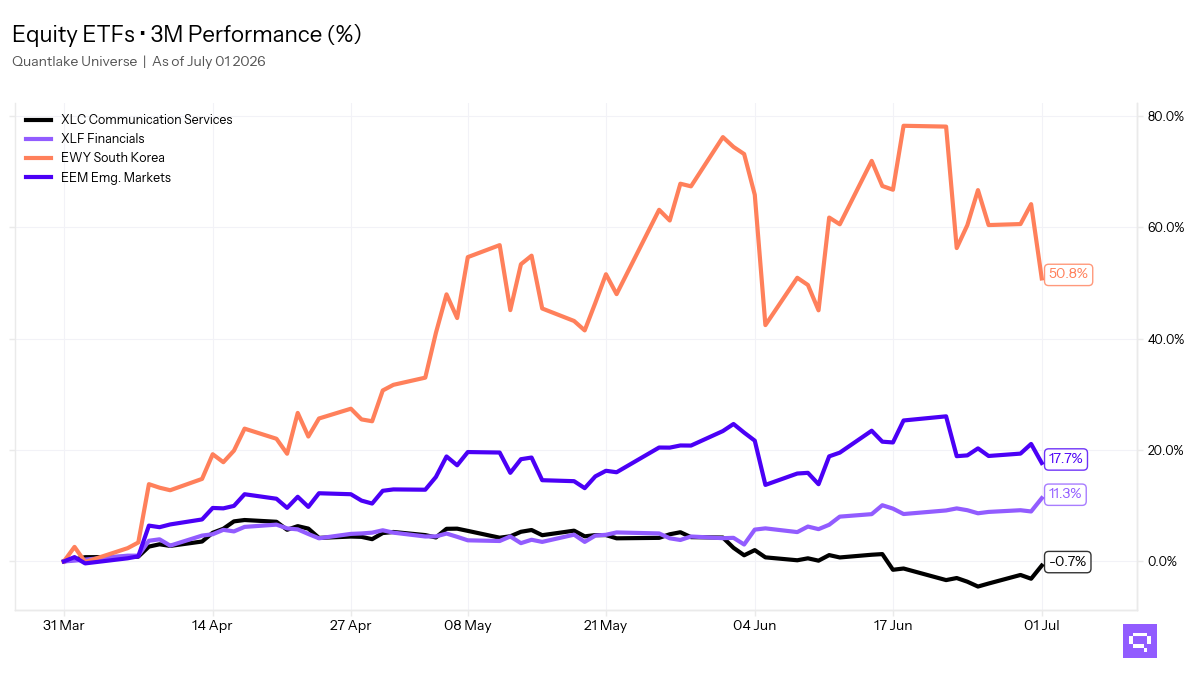
South Korea EWY fell 13.53% over the period and crossed below its 20D MA. EWY also crossed below its 20D ratio MA versus S&P 500 SPY, and South Korea now sits with emerging markets, China, and developed ex-US in the equity laggard cluster.
Semiconductors SMH crossed below both its 20D MA and 20D ratio MA versus S&P 500 SPY. Infrastructure PAVE also crossed below both measures after a 1.57% 20-day return. Specialty leadership now sits in biotech, low-volatility, real estate, and agriculture.
Short Corporate VCSH crossed above its 20D ratio MA versus Aggregate Bonds AGG. Long Treasuries TLT and Corporate Credit VCIT crossed below both their 20D MA and 20D ratio MAs versus AGG. The bond leadership profile centers in short duration and munis, with long duration and spread credit lagging.
FEATURED ETF: iShares MSCI South Korea ETF EWY

Other Technical Signal Events
EQUITY
↗ Price breakouts (cross-up 20D MA)
XLC - Communication Services Select Sector · 20D perf: -3.11%
↘ Price breakdowns (cross-down 20D MA)
IMTM - iShares MSCI Intl Momentum Factor ETF · 20D perf: -0.66%
VEA - Vanguard FTSE Developed Markets Index ETF · -2.20%
VWO - Vanguard FTSE Emerging Markets Index ETF · -3.10%
VLUE - iShares MSCI USA Value Factor ETF · -3.70%
EEM - iShares MSCI Emerging Markets ETF · -5.61%
XLK - Technology Select Sector · -6.24%
EWY - iShares MSCI South Korea ETF · -13.53%
↗ Leadership gains (cross-up 20D MA vs SPY)
DVY - iShares Select Dividend ETF · 20D relative perf: +3.83%
↘ Leadership losses (cross-down 20D MA vs SPY)
XLU - Utilities Select Sector · 20D relative perf: +4.27%
JEPI - JPMorgan Equity Premium Income ETF · +3.04%
IQLT - iShares MSCI Intl Quality Factor ETF · +2.42%
VGK - Vanguard FTSE Europe Index ETF · +1.60%
EFA - iShares MSCI EAFE ETF · +1.23%
IMTM - iShares MSCI Intl Momentum Factor ETF · +0.92%
URTH - iShares MSCI World ETF · +0.24%
VT - Vanguard Total World Stock Index ETF · -0.11%
QQQ - Invesco QQQ · -1.16%
EWZ - iShares MSCI Brazil ETF · -2.03%
IWF - iShares Russell 1000 Growth ETF · -2.50%
EEM - iShares MSCI Emerging Markets ETF · -4.11%
XLK - Technology Select Sector · -4.75%
EWY - iShares MSCI South Korea ETF · -12.16%
FIXED INCOME
↗ Price breakouts (cross-up 20D MA)
None on the close
↘ Price breakdowns (cross-down 20D MA)
TLT - iShares 20+ Year Treasury Bond ETF · 20D perf: -0.15%
VGIT - Vanguard Intermediate-Term Treasury Index ETF · -0.22%
IEF - iShares 7-10 Year Treasury Bond ETF · -0.22%
IEI - iShares 3-7 Year Treasury Bond ETF · -0.23%
EMB - iShares J.P. Morgan USD Emerging Markets Bond ETF · -0.25%
JNK - SPDR Bloomberg High Yield Bond ETF · -0.30%
VCIT - Vanguard Intermediate-Term Corporate Bond Index ETF · -0.30%
MBB - iShares MBS ETF · -0.33%
HYG - iShares iBoxx $ High Yield Corporate Bond ETF · -0.39%
LQD - iShares iBoxx $ Investment Grade Corporate Bond ETF · -0.42%
↗ Leadership gains (cross-up 20D MA vs AGG)
VCSH - Vanguard Short-Term Corporate Bond Index ETF · 20D relative perf: unch.
↘ Leadership losses (cross-down 20D MA vs AGG)
BNDX - Vanguard Total International Bond Index ETF · 20D relative perf: unch.
TLT - iShares 20+ Year Treasury Bond ETF · -0.27%
VGIT - Vanguard Intermediate-Term Treasury Index ETF · -0.34%
IEF - iShares 7-10 Year Treasury Bond ETF · -0.34%
EMB - iShares J.P. Morgan USD Emerging Markets Bond ETF · -0.37%
VCIT - Vanguard Intermediate-Term Corporate Bond Index ETF · -0.42%
SPECIALTY
↗ Price breakouts (cross-up 20D MA)
None on the close
↘ Price breakdowns (cross-down 20D MA)
PAVE - Global X U.S. Infrastructure Development ETF · 20D perf: +1.57%
SMH - VanEck Semiconductor ETF · -1.86%
↗ Leadership gains (cross-up 20D MA vs SPY)
None on the close
↘ Leadership losses (cross-down 20D MA vs SPY)
PAVE - Global X U.S. Infrastructure Development ETF · 20D relative perf: +3.18%
MTUM - iShares MSCI USA Momentum Factor ETF · +2.35%
JEPQ - JPMorgan Nasdaq Equity Premium Income ETF · +0.49%
SMH - VanEck Semiconductor ETF · -0.30%
COMMODITIES
↗ Price breakouts (cross-up 20D MA)
None on the close
↘ Price breakdowns (cross-down 20D MA)
None on the close
↗ Leadership gains (cross-up 20D MA vs SPY)
DBA - Invesco DB Agriculture · 20D relative perf: +0.62%
↘ Leadership losses (cross-down 20D MA vs SPY)
None on the close
Romain Gandon
CEO, Quantlake
Disclaimer: This article is for informational and educational purposes only and does not constitute investment advice. Past performance is not indicative of future results.