.png)
Tactical Trends: Equity Leadership Narrows as Cyclicals Roll Over
Benchmark leadership is carrying a thinner equity tape
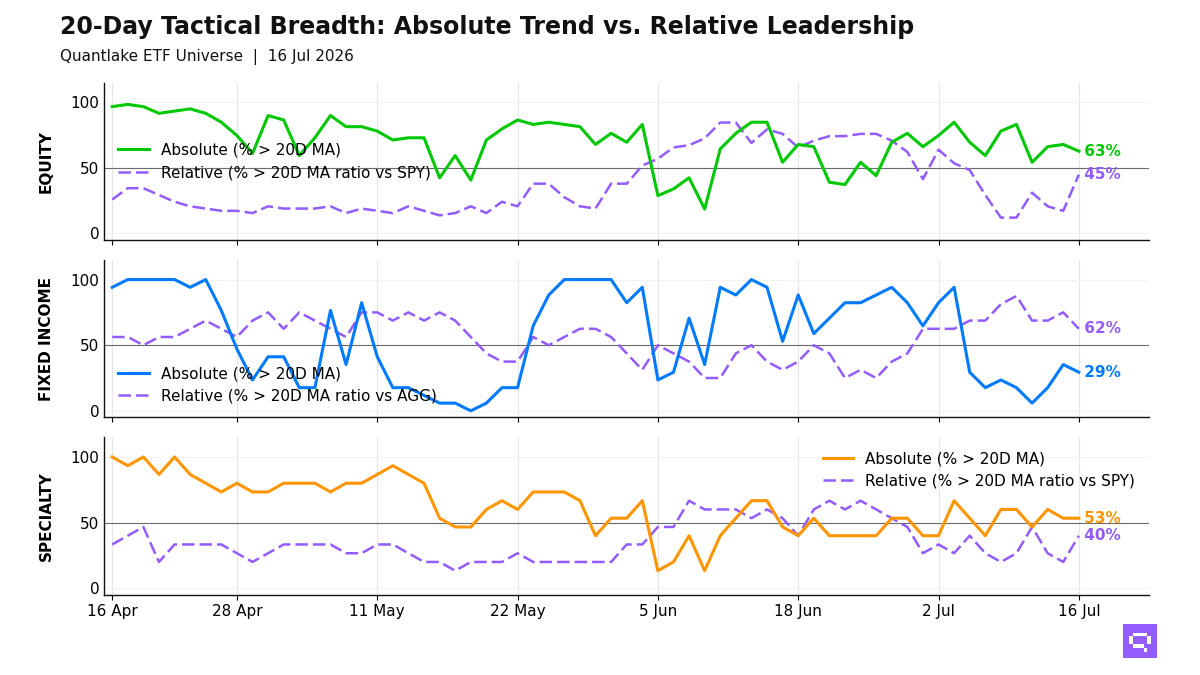
At the close, cyclical equity exposure lost ground across our ETF universe as Financials XLF broke below its 20-day moving average and Russell 2000 IWM slipped below its ratio moving average versus the S&P 500 SPY. Price breadth fell to 40 of 59 ETFs (68%, -13.6pp). Only 11 of 58 beat the S&P 500 SPY (19%, -1.7pp), leaving a +49pp gap as technology, US growth, Taiwan and South Korea carried the relative side. The equity tape is benchmark-led rather than broadly confirmed.
Fixed income has the strongest internal structure, with 17 of 17 ETFs (100%, unchanged on the day) above their 20-day moving average and 10 of 16 outperforming the Aggregate Bonds AGG (62%, unchanged on the day). Credit, EM debt, munis and long duration lead on a relative basis, while Treasuries, inflation-linked bonds and short duration hold above their moving averages without matching the benchmark. Bonds are in a broad participation regime with a clear duration and credit split.
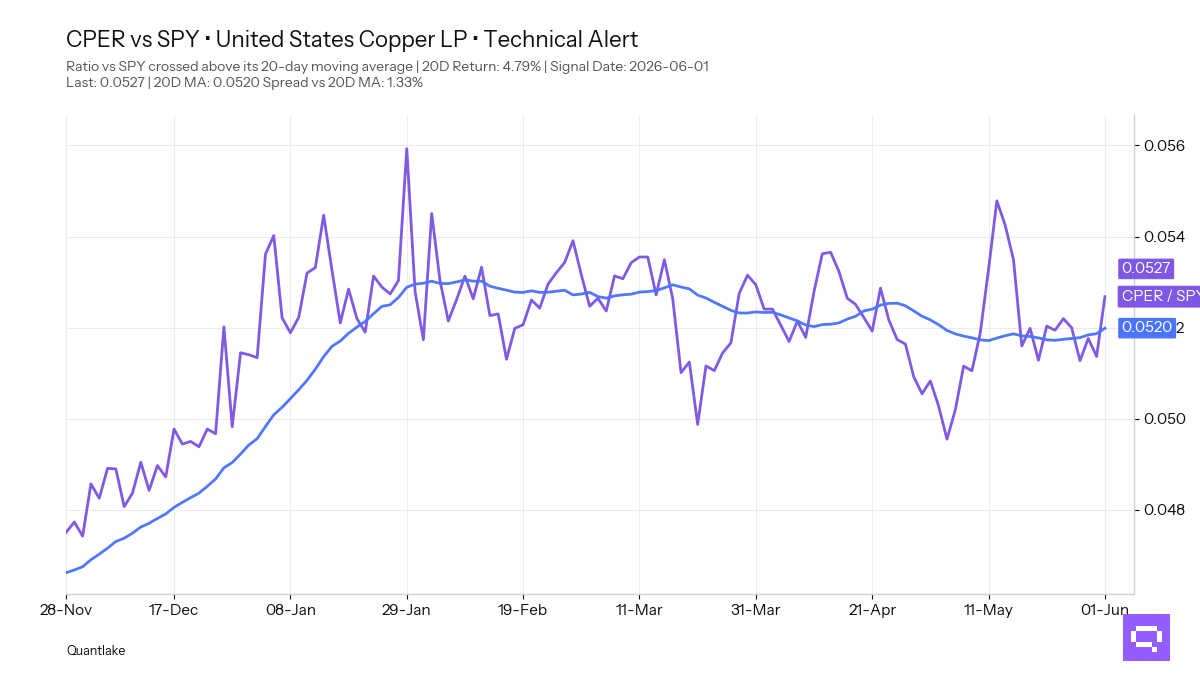
Specialty participation weakened further, with 6 of 15 ETFs (40%, -26.7pp) above their 20-day moving average and only 3 of 15 outperforming the S&P 500 SPY (20%, unchanged on the day), leaving a +20pp gap as semiconductors, momentum and clean energy held the relative side while crypto-linked exposure, real estate and infrastructure lost price support. Copper CPER, with a +4.79% period relative return versus SPY, crossed above its 20-day ratio moving average even as gold-linked exposure weakened elsewhere. Selective industrial-metal strength sits inside a broader specialty and commodity split.
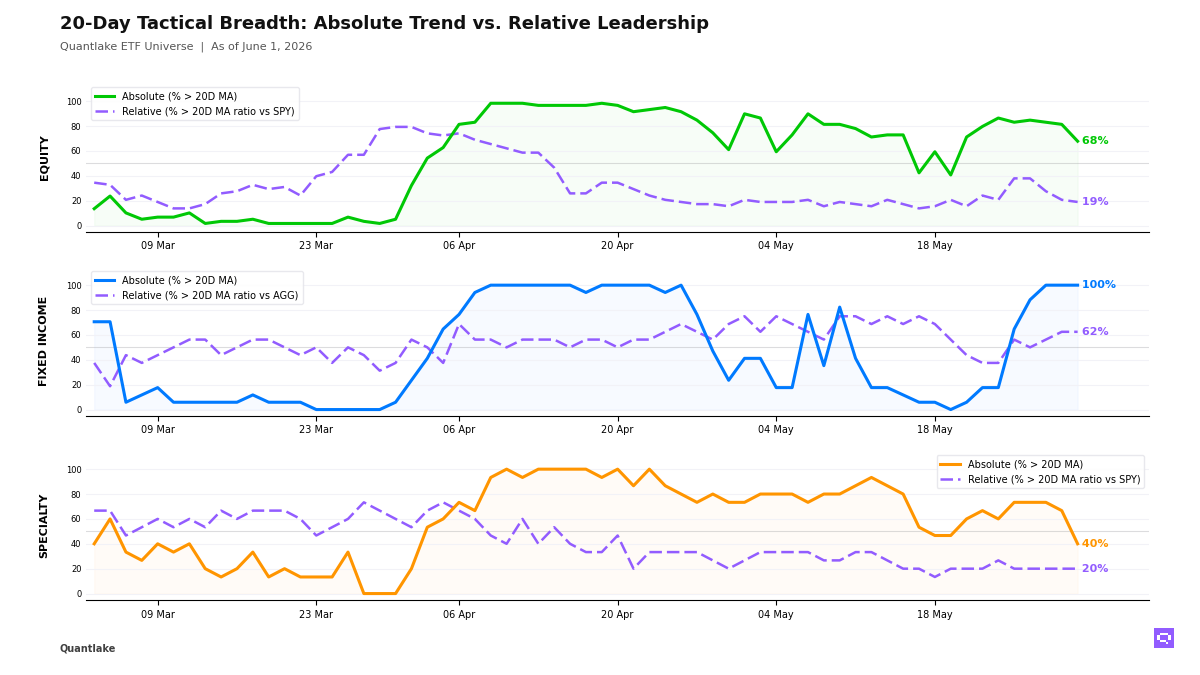
20-Day Tactical Breadth
Key Takeaways
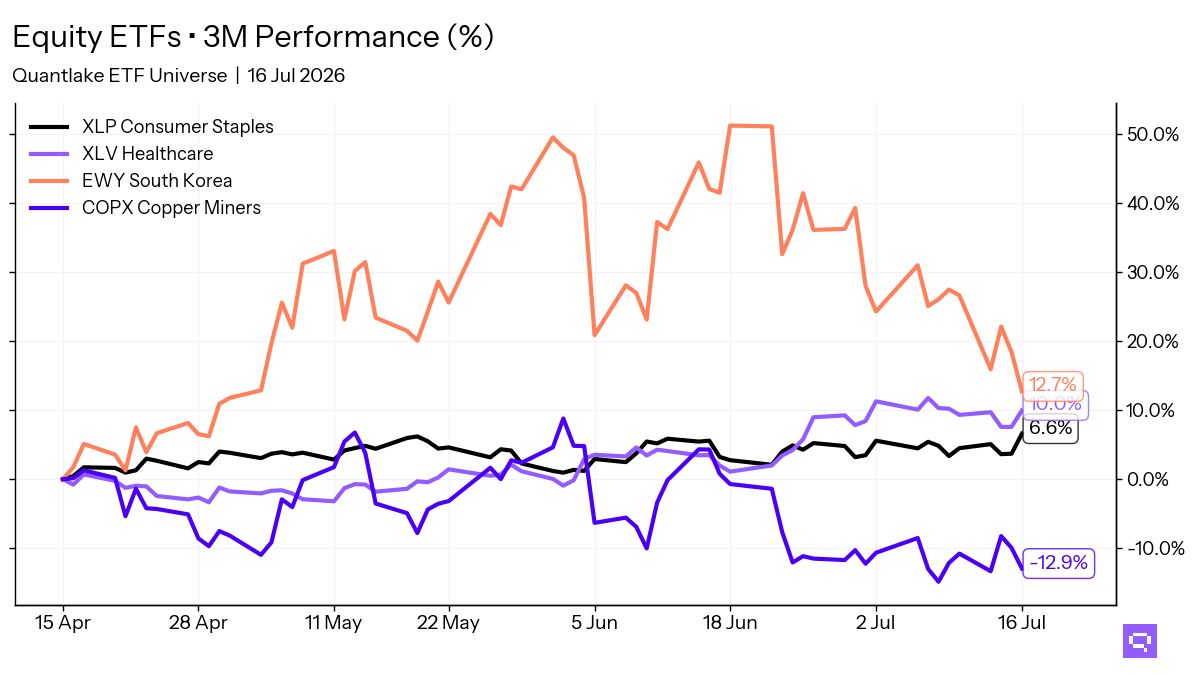
• Across daily, weekly and monthly windows, equity relative leadership stays concentrated in global miners COPX, emerging markets EEM, Taiwan EWT, South Korea EWY, Technology IYW and Nasdaq 100 QQQ. Developed ex-US, dividend, low-volatility, quality and several US cyclical groups sit on the lagging side across the same horizons. The equity structure stays concentrated in growth and selective Asia rather than distributed across our coverage.
• Within fixed income, the duration split is clean. Long Duration TLT sits with EM Debt EMB, high yield and investment grade on the relative-leadership side, while government exposure through 7 to 10 Year Treasury IEF and 3 to 7 Year Treasury IEI plus Short Duration VCSH stay above their 20-day moving averages but lag Aggregate Bonds AGG. That is a rate-sensitivity rotation inside a broad bond regime rather than uniform leadership across duration.
• Copper CPER, with a +4.79% period relative return versus SPY, crossed above its 20-day ratio moving average. Semiconductors SMH, Clean Energy ICLN and Momentum MTUM still hold relative leadership versus the benchmark, but Long/Short Equity FTLS, Infrastructure PAVE and Gold Miners GDX lost their 20-day price support. Industrial metals are separating from a weaker specialty mix.
FEATURED ETF — United States Copper LP CPER vs SPY
Other Technical Signal Events
EQUITY
↗ Price breakouts (cross-up 20D MA)
None on the close
↘ Price breakdowns (cross-down 20D MA)
• IQLT - iShares MSCI Intl Quality Factor ETF · 20D perf: +0.60%
• XLI - Industrial Select Sector · -0.32%
• XLY - Consumer Discretionary Select Sector · -0.37%
• EWU - iShares MSCI United Kingdom ETF · -0.70%
• SDY - SPDR® S&P Dividend ETF · -0.82%
• XLB - Materials Select Sector · -0.84%
• XLF - Financial Select Sector · -0.94%
• INDA - iShares MSCI India ETF · -2.30%
↗ Leadership gains (cross-up 20D MA vs SPY)
None on the close
↘ Leadership losses (cross-down 20D MA vs SPY)
• IWM - iShares Russell 2000 ETF · 20D relative perf: -1.70%
FIXED INCOME
No event on the close
SPECIALTY
↗ Price breakouts (cross-up 20D MA)
None on the close
↘ Price breakdowns (cross-down 20D MA)
• IBB - iShares Biotechnology ETF · 20D perf: +1.26%
• FTLS - First Trust Long/Short Equity ETF · +0.63%
• GDX - VanEck Gold Miners ETF · -0.49%
• PAVE - Global X U.S. Infrastructure Development ETF · -1.25%
↗ Leadership gains (cross-up 20D MA vs SPY)
None on the close
↘ Leadership losses (cross-down 20D MA vs SPY)
None on the close
COMMODITIES
↗ Price breakouts (cross-up 20D MA)
None on the close
↘ Price breakdowns (cross-down 20D MA)
None on the close
↗ Leadership gains (cross-up 20D MA vs SPY)
• CPER - United States Copper LP · 20D relative perf: +4.79%
↘ Leadership losses (cross-down 20D MA vs SPY)
None on the close
Romain Gandon
CEO, Quantlake
Disclaimer: This article is for informational and educational purposes only and does not constitute investment advice. Past performance is not indicative of future results.