.png)
Tactical Trends: Equity Breaks Lower Into Defensive Rotation
Price damage widened faster than relative weakness across our universe
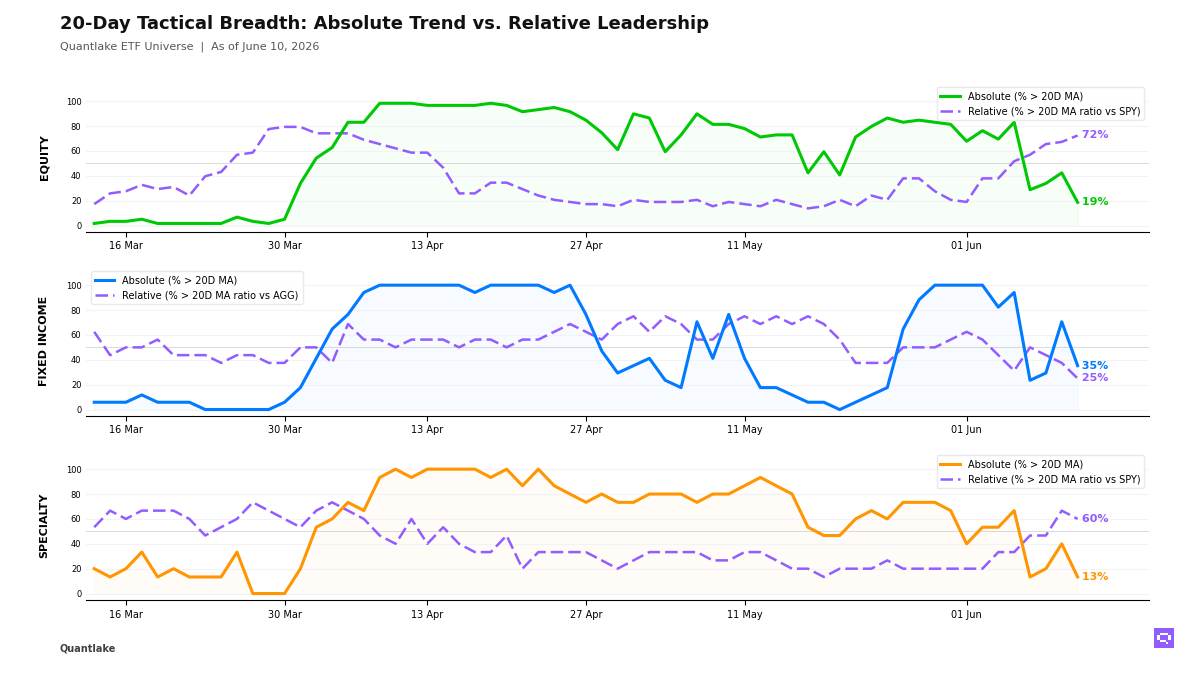
At the close, equity participation in our ETF universe broke lower even as benchmark-relative rotation turned defensive. Only 11 of 59 ETFs (19%, -23.7pp on the day) held above their 20-day moving average (20D MA), while 42 of 58 (72%, +5.2pp) still outperformed the S&P 500 SPY, producing a -54pp abs/rel gap. Value, dividend, low-volatility, and selective international exposures carried the relative winners. Growth, technology, China, Brazil, and emerging markets lost ground. The equity regime is defensive rotation because price weakness broadened faster than relative weakness.
Fixed income weakened across both price and relative measures. Only 6 of 17 ETFs (35%, -35.3pp on the day) held above their 20D MA, and just 4 of 16 (25%, -12.5pp) beat the Aggregate Bonds AGG as high yield, investment grade, intermediates, and international bonds rolled over together. EM debt, mortgages, munis, and long duration held the remaining relative support. The bond regime is broad weakness with leadership confined to duration and higher-quality spread segments.
Specialty participation thinned. Only 2 of 15 ETFs (13%, -26.7pp on the day) stood above their 20D MA, and 9 of 15 (60%, -6.7pp) still outperformed the S&P 500 SPY. Real estate carried the only price leadership. Semiconductors and infrastructure kept relative support without price confirmation. Copper CPER lost relative ground vs SPY alongside gold and bitcoin-linked names. The specialty and commodity mix is a price decline with relative resilience concentrated in a few residual leaders.
20-Day Tactical Breadth
Key Takeaways
• US smaller-cap, mid-cap, value, and real estate exposures carried the cross-timescale relative leadership versus the S&P 500 SPY. Cross-timescale alignment retained Taiwan EWT, Russell 2000 IWM, and S&P MidCap Growth MDYG among the relative leaders even after Taiwan EWT and Russell 2000 IWM crossed below their 20D MA in price. The equity distribution favors size and factor rotation rather than technology-led leadership.
• Mortgage-Backed MBB crossed above its 20-day ratio moving average versus Aggregate Bonds AGG (20D ratio MA vs AGG), while High Yield Bonds JNK and Investment Grade Credit LQD crossed below their 20D ratio MA versus AGG. 7-10yr Treasuries IEF, Corporate Credit VCIT, and Global Bonds BNDX also fell below their 20D MA, and cross-timescale relative leaders narrowed to EM debt and munis. The bond distribution is defensive because mortgages and municipal credit held up while credit beta and intermediate duration deteriorated.
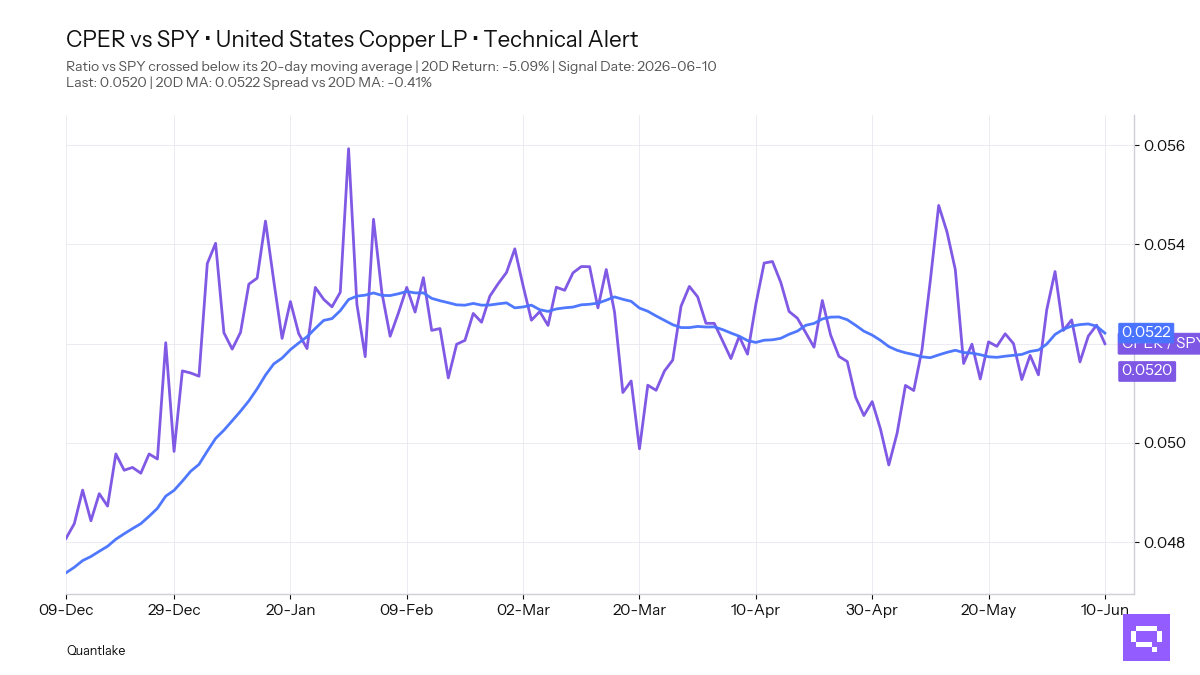
• Semiconductors SMH, Infrastructure PAVE, Biotechnology IBB, and Momentum Factor MTUM all crossed below their 20D MA. Semiconductors, infrastructure, momentum, and real estate still outperformed the S&P 500 SPY on a trailing basis. Copper CPER, with a -5.09% period relative return versus SPY, crossed below its 20D ratio MA versus SPY. The specialty and commodity distribution shows relative resilience without price confirmation, and hard-asset leadership is deteriorating.
FEATURED ETF — United States Copper LP CPER vs SPY
Other Technical Signal Events
EQUITY
↗ Price breakouts (cross-up 20D MA)
None on the close
↘ Price breakdowns (cross-down 20D MA)
• VLUE - iShares MSCI USA Value Factor ETF · 20D perf: +4.60%
• EWT - iShares MSCI Taiwan ETF · +4.51%
• SCHD - Schwab U.S. Dividend Equity ETF · +1.57%
• VIG - Vanguard Dividend Appreciation · +1.28%
• QUAL - iShares MSCI USA Quality Factor ETF · +0.92%
• VYM - Vanguard High Dividend Yield · +0.80%
• DIA - SPDR Dow Jones Industrial Average ETF · +0.53%
• VO - Vanguard Mid-Cap · +0.51%
• VB - Vanguard Small-Cap · +0.28%
• SPYV - SPDR® Portfolio S&P 500 Value ETF · unch.
• IWM - iShares Russell 2000 ETF · -0.18%
• JEPI - JPMorgan Equity Premium Income ETF · -0.72%
• MDYG - SPDR® S&P 400 Mid Cap Growth ETF · -0.91%
• XLI - Industrial Select Sector · -2.69%
↗ Leadership gains (cross-up 20D MA vs SPY)
• IDV - iShares International Select Dividend ETF · 20D relative perf: -1.24%
• VWO - Vanguard FTSE Emerging Markets · -1.10%
• XLE - Energy Select Sector · +2.96%
↘ Leadership losses (cross-down 20D MA vs SPY)
None on the close
FIXED INCOME
↗ Price breakouts (cross-up 20D MA)
None on the close
↘ Price breakdowns (cross-down 20D MA)
• BNDX - Vanguard Total International Bond · 20D perf: +0.43%
• LQD - iShares iBoxx $ Investment Grade Corporate Bond ETF · unch.
• HYG - iShares iBoxx $ High Yield Corporate Bond ETF · unch.
• JNK - SPDR® Bloomberg High Yield Bond ETF · unch.
• VCIT - Vanguard Intermediate-Term Corporate Bond · -0.22%
• IEF - iShares 7-10 Year Treasury Bond ETF · -0.33%
↗ Leadership gains (cross-up 20D MA vs AGG)
• MBB - iShares MBS ETF · 20D relative perf: unch.
↘ Leadership losses (cross-down 20D MA vs AGG)
• BNDX - Vanguard Total International Bond · 20D relative perf: +0.41%
• LQD - iShares iBoxx $ Investment Grade Corporate Bond ETF · unch.
• JNK - SPDR® Bloomberg High Yield Bond ETF · unch.
SPECIALTY
↗ Price breakouts (cross-up 20D MA)
None on the close
↘ Price breakdowns (cross-down 20D MA)
• SMH - VanEck Semiconductor ETF · 20D perf: +1.72%
• MTUM - iShares MSCI USA Momentum Factor ETF · +0.55%
• PAVE - Global X U.S. Infrastructure Development ETF · -2.16%
• IBB - iShares Biotechnology ETF · -3.69%
↗ Leadership gains (cross-up 20D MA vs SPY)
None on the close
↘ Leadership losses (cross-down 20D MA vs SPY)
• JEPQ - JPMorgan Nasdaq Equity Premium Income ETF · 20D relative perf: -0.17%
COMMODITIES
↗ Price breakouts (cross-up 20D MA)
None on the close
↘ Price breakdowns (cross-down 20D MA)
None on the close
↗ Leadership gains (cross-up 20D MA vs SPY)
None on the close
↘ Leadership losses (cross-down 20D MA vs SPY)
• CPER - United States Copper LP · 20D relative perf: -5.09%
Romain Gandon
CEO, Quantlake
Disclaimer: This article is for informational and educational purposes only and does not constitute investment advice. Past performance is not indicative of future results.