.png)

Tactical Trends: Equal Weight and Small Caps Lose the 20D Line
Defensive relative strength outruns outright price support
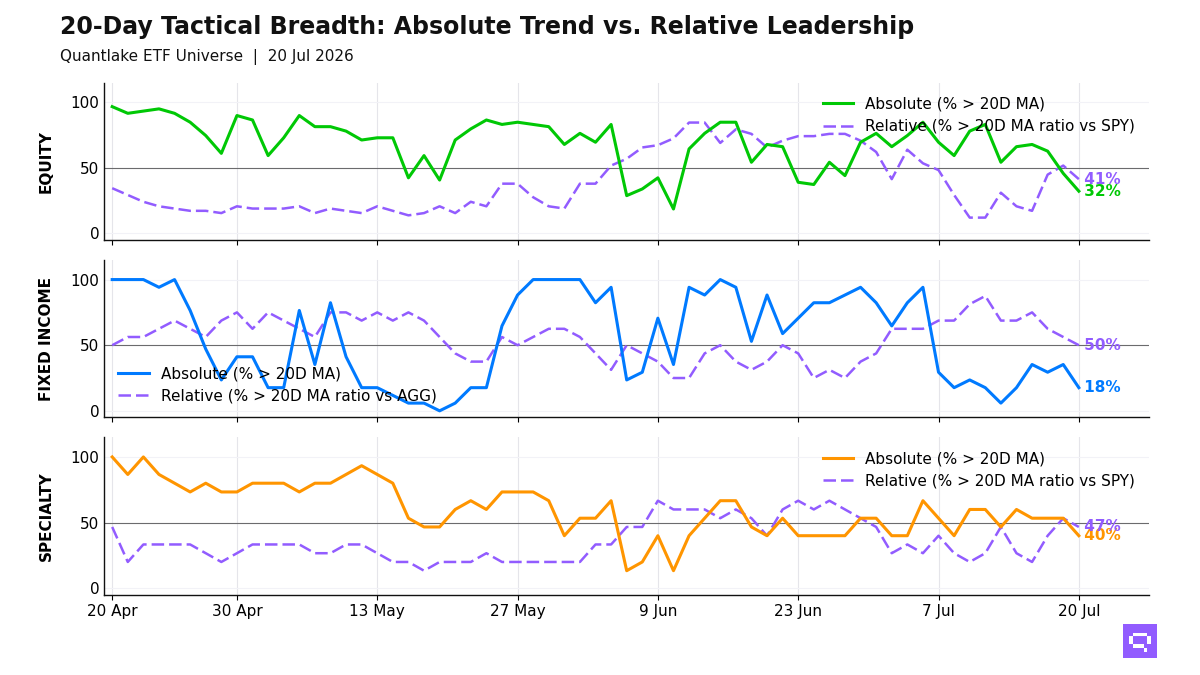
Breadth deterioration hit equal-weight and smaller-cap equity at the close on July 20, as Equal Weight S&P 500 RSP and Small-Cap IJR crossed below their 20-day moving average (20D MA). Across our ETF universe, 19 of 59 equity ETFs (32%, -13.6pp) hold above their 20D MA, and 24 of 58 hold above their 20-day ratio moving average vs S&P 500 SPY (20D ratio MA vs SPY) (41%, -10.3pp). Low-volatility and dividend-heavy US equity dominate the leader cluster. Small caps, emerging markets, and developed ex-US lag. Daily, weekly, and monthly equity alignment reads 31%. The equity profile reflects defensive relative strength in a weak price field.
Fixed income leadership is limited to high-yield credit and short duration, with only 3 of 17 bond ETFs above their 20D MA. 3-7yr Treasuries IEI and TIPS TIP crossed below their 20D MA, yet Treasuries and short duration outperform Aggregate Bonds AGG, while long-duration and investment-grade credit lag the benchmark. The fixed-income profile concentrates in stability and selective credit.
Specialty leadership is limited to crypto-linked and real estate names, while gold miners, clean energy, and momentum-sensitive exposures lag S&P 500 SPY. Commodities add support from copper and broad commodity baskets, with silver on the weak side. Specialty and commodity leadership is selective, so equity weakness defines the cross-asset distribution.
20-Day Tactical Breadth
Key Takeaways
Quality Factor QUAL and Equal Weight S&P 500 RSP rank among five equity ETFs that trade below their 20D MA and outperform the S&P 500 SPY on a 20D ratio basis. Dividend Growth VIG, High Dividend VYM, and Healthcare XLV complete that group. The equity leader set skews defensive on a relative basis, with 5 of 5 leaders concentrated in quality, dividend, equal-weight, and healthcare exposures.
3-7yr Treasuries IEI and Short Corporate VCSH rank among five bond ETFs that trade below their 20D MA and outperform Aggregate Bonds AGG on a 20D ratio basis. TIPS TIP joins that group. Long-duration and investment-grade credit populate the relative laggards. The bond split favors stability and short duration, with 3 of 5 relative leaders in IEI, VCSH, and TIP.
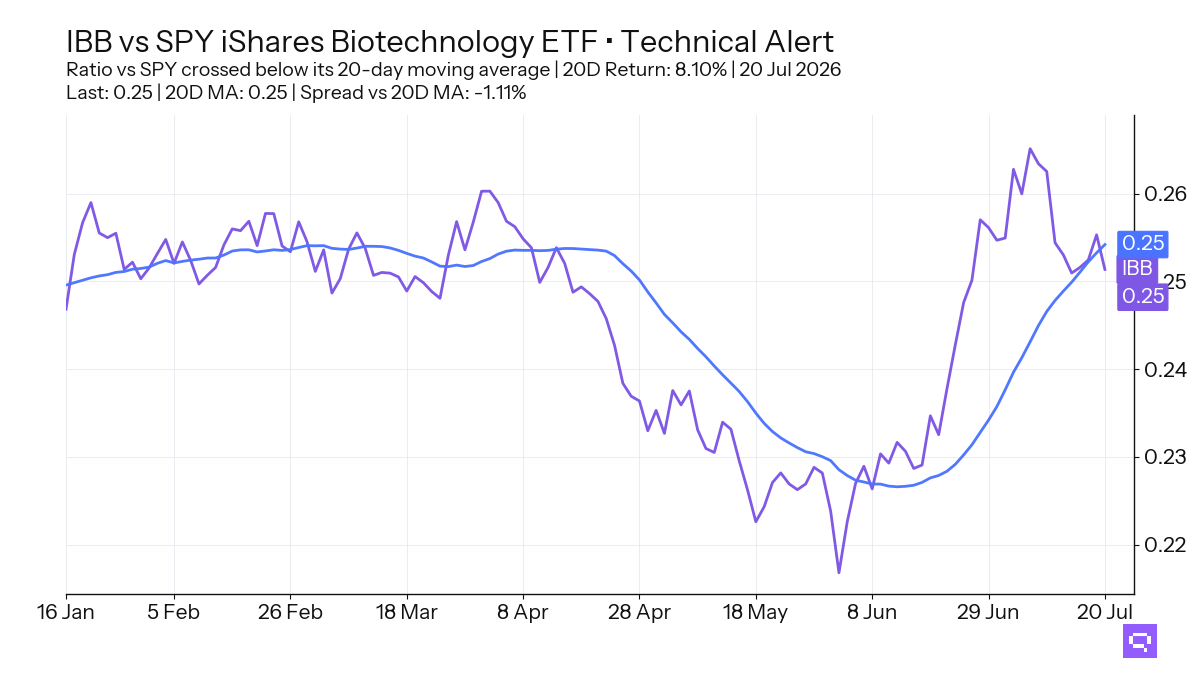
Biotechnology IBB, up 7.42% over the trailing 20-day window, crossed below its 20-day moving average. Its ratio versus S&P 500 SPY also crossed below its 20D ratio MA versus SPY. Biotechnology joins eight specialty ETFs that lag the benchmark. The specialty laggard cluster skews toward growth-sensitive and precious-metals exposures, with 8 laggards concentrated in those groups.
FEATURED ETF: iShares Biotechnology ETF IBB
Other Technical Signal Events
Equity: Price vs 20-day MA
| Signal | Ticker | Name | 20D perf |
|---|---|---|---|
| Cross-down | XLV | Health Care Select Sector | +7.06% |
| Cross-down | RSP | Invesco S&P 500 Equal Weight ETF | +1.56% |
| Cross-down | IJR | iShares Core S&P Small-Cap ETF | +1.32% |
| Cross-down | VYM | Vanguard High Dividend Yield Index ETF | +0.76% |
| Cross-down | VIG | Vanguard Dividend Appreciation Index ETF | +0.75% |
| Cross-down | QUAL | iShares MSCI USA Quality Factor ETF | +0.49% |
| Cross-down | IQLT | iShares MSCI Intl Quality Factor ETF | -0.57% |
| Cross-down | VGK | Vanguard FTSE Europe Index ETF | -0.66% |
Equity vs SPY: Price Ratio vs 20-day MA
| Signal | Ticker | Name | 20D rel perf |
|---|---|---|---|
| Cross-down | IJR | iShares Core S&P Small-Cap ETF | +1.95% |
| Cross-down | VO | Vanguard Mid-Cap Index ETF | +0.72% |
| Cross-down | IQLT | iShares MSCI Intl Quality Factor ETF | unch. |
| Cross-down | VGK | Vanguard FTSE Europe Index ETF | unch. |
| Cross-down | URTH | iShares MSCI World ETF | -0.18% |
| Cross-down | IVLU | iShares Edge MSCI Intl Value Factor ETF | -0.28% |
Fixed Income: Price vs 20-day MA
| Signal | Ticker | Name | 20D perf |
|---|---|---|---|
| Cross-down | VCSH | Vanguard Short-Term Corporate Bond Index ETF | unch. |
| Cross-down | IEI | iShares 3-7 Year Treasury Bond ETF | unch. |
| Cross-down | TIP | iShares TIPS Bond ETF | -0.26% |
Fixed Income vs AGG: Price Ratio vs 20-day MA
| Signal | Ticker | Name | 20D rel perf |
|---|---|---|---|
| Cross-down | VCIT | Vanguard Intermediate-Term Corporate Bond Index ETF | unch. |
Specialty: Price vs 20-day MA
| Signal | Ticker | Name | 20D perf |
|---|---|---|---|
| Cross-down | IBB | iShares Biotechnology ETF | +7.42% |
| Cross-down | USMV | iShares MSCI USA Min Vol Factor ETF | +2.40% |
Specialty vs SPY: Price Ratio vs 20-day MA
| Signal | Ticker | Name | 20D rel perf |
|---|---|---|---|
| Cross-down | IBB | iShares Biotechnology ETF | +8.10% |
Romain Gandon
CEO, Quantlake
Disclaimer: This article is for informational and educational purposes only and does not constitute investment advice. Past performance is not indicative of future results.