.png)

Tactical Trends: Defensives, Dividends and Value Take Equity Leadership
Relative leadership improves even as price participation slips
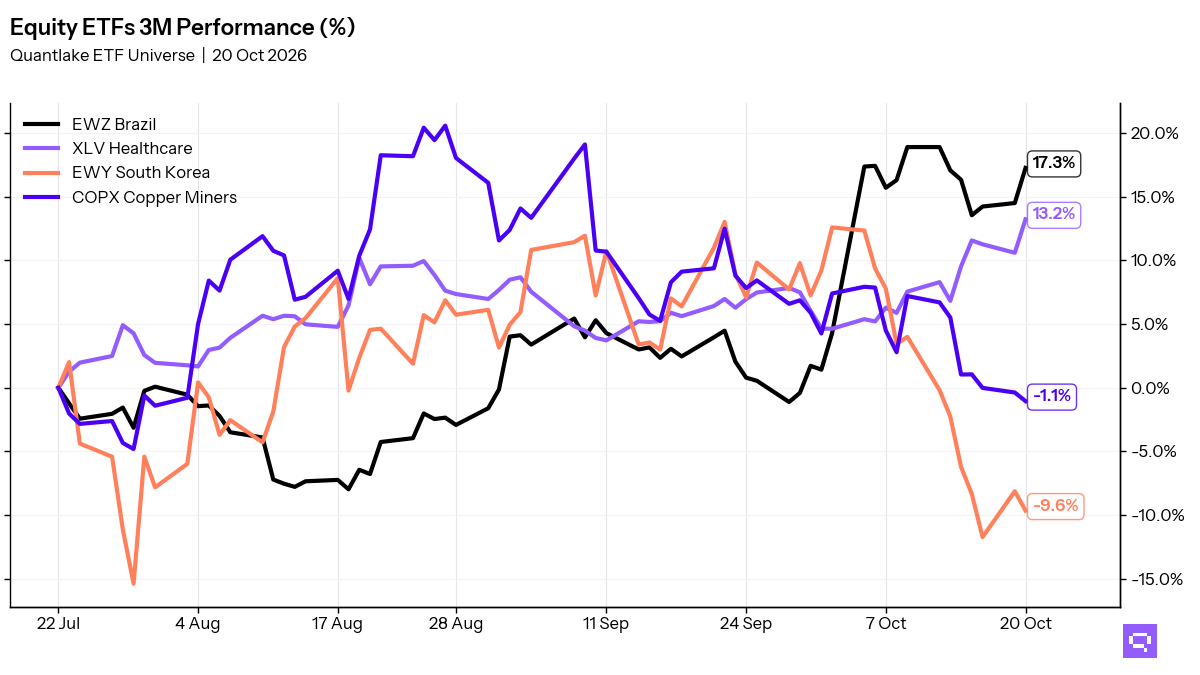
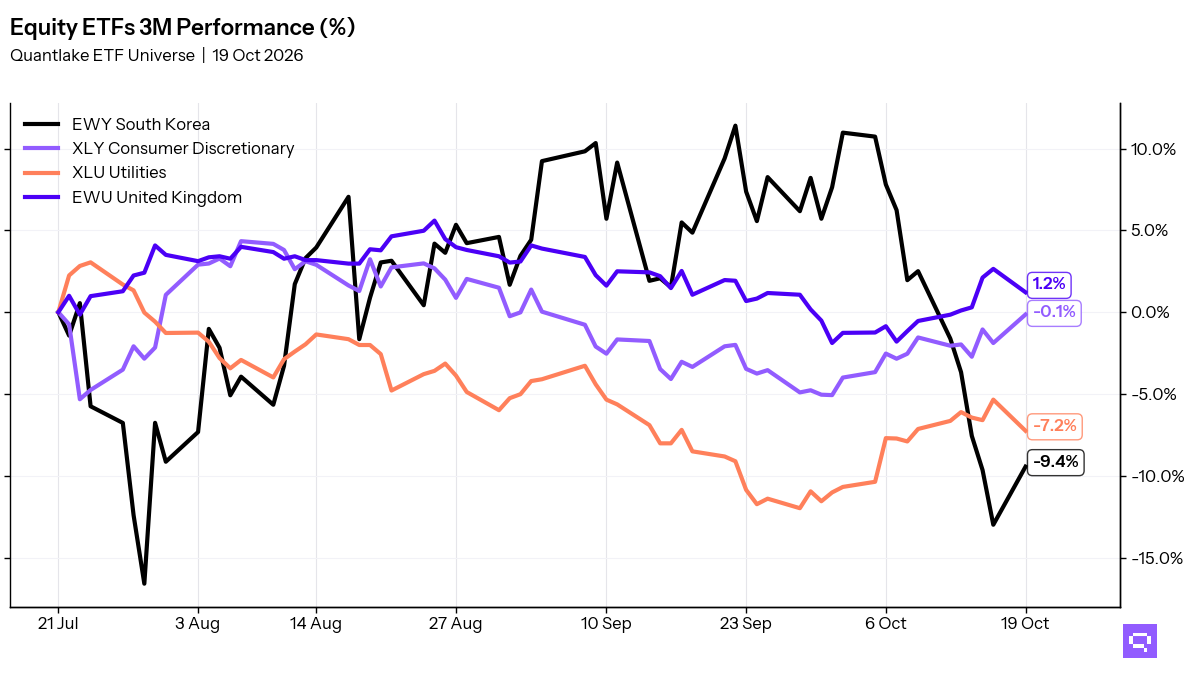
Defensive and value rotation leads our ETF universe at the close on July 22. In equity, 33 of 59 ETFs (56%, -5.1pp on the day) hold above their 20-day moving average (20D MA), and 26 of 58 (45%, +8.6pp) hold above their 20-day ratio moving average vs S&P 500 SPY (20D ratio MA vs SPY). Utilities XLU crossed above its 20D MA as Small-Cap IJR crossed below, and the 11pp price-relative gap narrowed. Dividend, value, and developed ex-US exposures improved against the benchmark, while growth, small-cap, and Asia-linked names lagged. The equity cross-section favors defensive and value selection over broad index exposure.
Fixed income leadership is limited to short duration and preferreds, with 2 of 17 ETFs (12%) above their 20D MA. Relative to the Aggregate Bonds AGG, Preferred Stock PFF holds on the leading side while EM Sovereign Bonds EMB joins long duration and investment grade in the laggard cluster. Bond participation concentrates in short duration and selected credit.
Specialty leadership concentrates in hard assets and real estate, while semiconductors, clean energy, and momentum-oriented equity ETFs fill the laggard side. Precious metals anchor the commodity signals, and the non-equity leadership cluster tilts toward real assets.
20-Day Tactical Breadth

Key Takeaways
Dividend Aristocrats SDY, Value Factor VLUE, and developed markets EFA crossed above their 20D ratio MA versus S&P 500 SPY. Global Min Vol ACWV crossed below its 20D ratio MA versus SPY even though it holds above its 20D MA, so the defensive bid concentrates in dividend, value, and developed ex-US leadership.
Preferred Stock PFF crossed above its 20D MA. Mortgage-Backed MBB and EM Sovereign Bonds EMB crossed below their 20D ratio MA versus Aggregate Bonds AGG. International aggregate, short duration, and high yield occupy the relative leader cluster, so bond strength concentrates in short duration and selected credit.
Silver SLV, down 3.25% over the trailing 20-day window, crossed above its 20-day moving average. Gold Miners GDX also crossed above its 20D MA and above its 20D ratio MA versus S&P 500 SPY, so precious-metals participation spans both bullion and miners.
FEATURED ETF: iShares Silver SLV

Other Technical Signal Events
Equity: Price vs 20-day MA
| Signal | Ticker | Name | 20D perf |
|---|---|---|---|
| Cross-up | XLP | Consumer Staples Select Sector | +0.79% |
| Cross-up | XLU | Utilities Select Sector | +1.91% |
| Cross-down | XLV | Health Care Select Sector | +4.76% |
| Cross-down | IJR | iShares Core S&P Small-Cap ETF | +2.11% |
| Cross-down | QUAL | iShares MSCI USA Quality Factor ETF | +2.03% |
| Cross-down | XLC | Communication Services Select Sector | +1.80% |
| Cross-down | SPYG | S&P 500 Growth ETF | +1.71% |
Equity vs SPY: Price Ratio vs 20-day MA
| Signal | Ticker | Name | 20D rel perf |
|---|---|---|---|
| Cross-up | VLUE | iShares MSCI USA Value Factor ETF | -2.66% |
| Cross-up | IMTM | iShares MSCI Intl Momentum Factor ETF | -1.69% |
| Cross-up | EFA | iShares MSCI EAFE ETF | -0.14% |
| Cross-up | XLU | Utilities Select Sector | unch. |
| Cross-up | JEPI | JPMorgan Equity Premium Income ETF | +0.28% |
| Cross-up | SDY | SPDR S&P Dividend ETF | +0.98% |
| Cross-down | ACWV | iShares MSCI Global Min Vol Factor ETF | unch. |
Fixed Income: Price vs 20-day MA
| Signal | Ticker | Name | 20D perf |
|---|---|---|---|
| Cross-up | PFF | iShares Preferred and Income Securities ETF | -0.61% |
Fixed Income vs AGG: Price Ratio vs 20-day MA
| Signal | Ticker | Name | 20D rel perf |
|---|---|---|---|
| Cross-down | EMB | iShares J.P. Morgan USD Emerging Markets Bond ETF | unch. |
| Cross-down | MBB | iShares MBS ETF | unch. |
Specialty: Price vs 20-day MA
| Signal | Ticker | Name | 20D perf |
|---|---|---|---|
| Cross-up | GDX | VanEck Gold Miners ETF | -1.26% |
| Cross-down | JEPQ | JPMorgan Nasdaq Equity Premium Income ETF | +0.37% |
Specialty vs SPY: Price Ratio vs 20-day MA
| Signal | Ticker | Name | 20D rel perf |
|---|---|---|---|
| Cross-up | GDX | VanEck Gold Miners ETF | -3.09% |
Commodities: Price vs 20-day MA
| Signal | Ticker | Name | 20D perf |
|---|---|---|---|
| Cross-up | SLV | iShares Silver | -3.25% |
Commodities vs SPY: Price Ratio vs 20-day MA
| Signal | Ticker | Name | 20D rel perf |
|---|---|---|---|
| Cross-up | SLV | iShares Silver | -5.04% |
Romain Gandon
CEO, Quantlake
Disclaimer: This article is for informational and educational purposes only and does not constitute investment advice. Past performance is not indicative of future results.