.png)

Tactical Trends: Defensive Equity Rotation Deepens
Low-volatility and value lead as equity price breadth breaks lower.
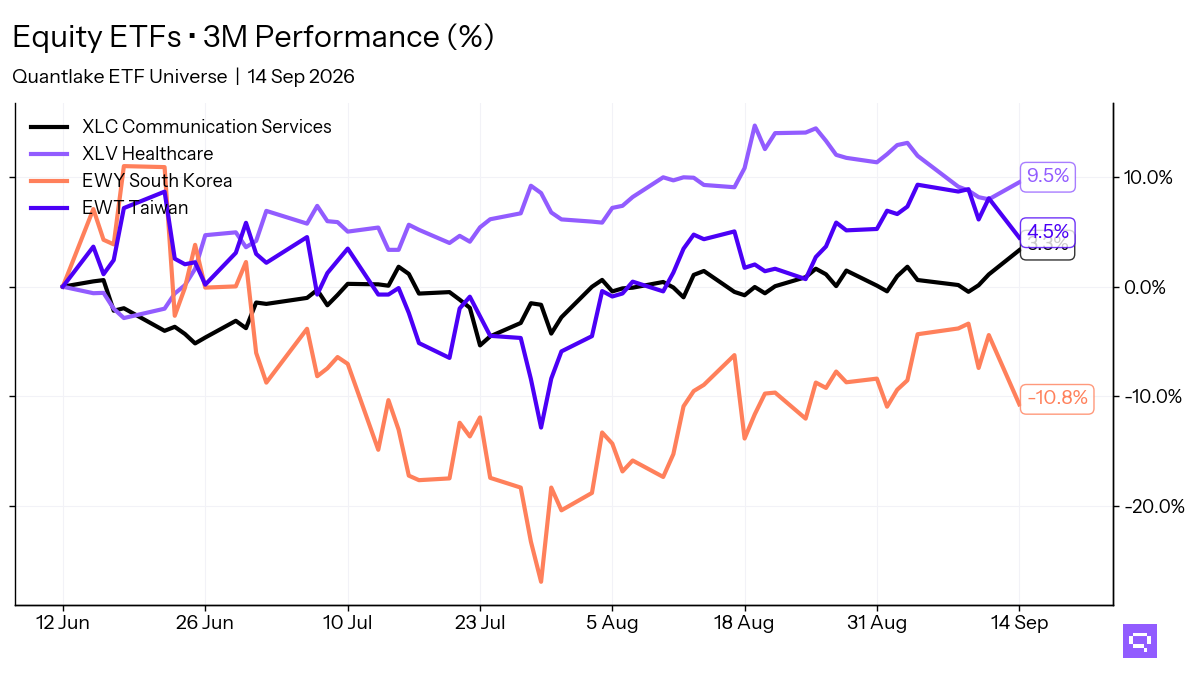
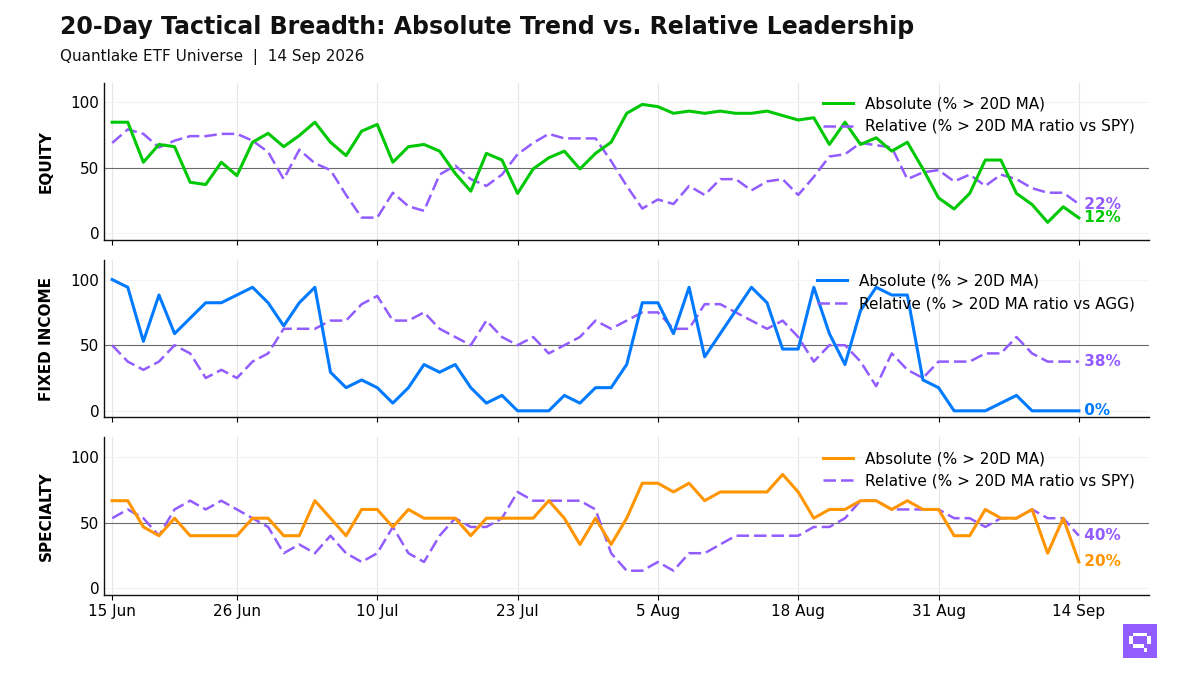
Low-volatility and value define equity leadership on September 14. Only 7 of 59 ETFs (12%, -8.5pp on the session) closed above their 20-day moving average (20D MA), and 13 of 58 (22%, -8.6pp) held above their 20-day ratio MA vs the S&P 500 SPY. Emerging markets, growth, and international momentum fill the laggard side. The equity book sits in a broad bear regime, and the 11pp negative price-relative gap concentrates leadership in defensive relative winners.
Fixed income offers no absolute participation, with 0 of 17 above their 20D MA at the close. Short duration, TIPS, and high yield beat the Aggregate Bonds AGG. Treasuries, investment grade, and preferred lag. The bond cross-section splits between lower-duration relative winners and rate-sensitive laggards.
Crypto-linked alternatives form the specialty leader cluster, with 3 of 15 above their 20D MA. Clean energy, real estate, and semiconductors fill the laggard side. Commodities posted no fresh daily crosses, and oil, broad commodities, and agriculture hold the current leader group. Specialty strength is concentrated, and commodities retain a separate leadership pocket.
20-Day Tactical Breadth
Key Takeaways
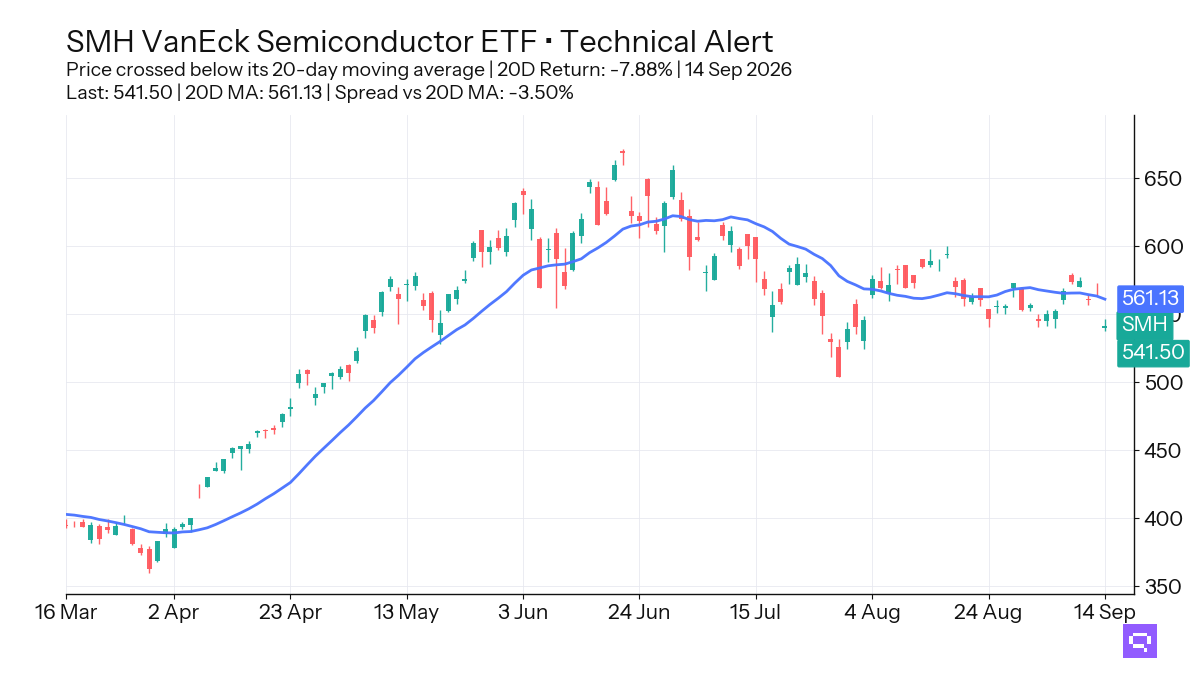
Semiconductors SMH, down 7.88% over the trailing 20-day window, crossed below its 20D MA. Its ratio vs the S&P 500 SPY also crossed below its 20-day ratio MA after a 6.01% 20-day relative loss. Semiconductor weakness spans both absolute and relative dimensions.
Global Min Vol ACWV crossed above its 20-day ratio MA vs the S&P 500 SPY, and S&P Value SPYV did the same after a 0.69% 20-day relative gain. Emerging markets EEM and South Korea EWY crossed below both their price MA and their ratio MA vs the benchmark. Equity leadership shifts toward defense and away from higher-beta international exposure.
TIPS TIP crossed above its 20-day ratio MA vs Aggregate Bonds AGG, while Preferred Stock PFF crossed below its 20-day ratio MA. Cross-timescale fixed-income alignment is 82%, with short duration, inflation-linked bonds, and high yield in the relative winner group. The bond cross-section splits between lower-duration relative winners and rate-sensitive laggards.
FEATURED ETF: VanEck Semiconductor ETF SMH
Other Technical Signal Events
Equity: Price vs 20-day MA
| Signal | Ticker | Name | 20D perf |
|---|---|---|---|
| Cross-up | EFAV | iShares MSCI EAFE Min Vol Factor ETF | +0.81% |
| Cross-down | IDV | iShares International Select Dividend ETF | +0.18% |
| Cross-down | EWT | iShares MSCI Taiwan ETF | +0.13% |
| Cross-down | EEM | iShares MSCI Emerging Markets ETF | -0.93% |
| Cross-down | VLUE | iShares MSCI USA Value Factor ETF | -1.69% |
| Cross-down | EWY | iShares MSCI South Korea ETF | -1.96% |
| Cross-down | XLK | Technology Select Sector | -3.02% |
Equity vs SPY: Price Ratio vs 20-day MA
| Signal | Ticker | Name | 20D rel perf |
|---|---|---|---|
| Cross-up | SPYV | S&P 500 Value ETF | +0.69% |
| Cross-up | ACWV | iShares MSCI Global Min Vol Factor ETF | +1.93% |
| Cross-down | VWO | Vanguard FTSE Emerging Markets Index ETF | +1.18% |
| Cross-down | EEM | iShares MSCI Emerging Markets ETF | +1.08% |
| Cross-down | EWY | iShares MSCI South Korea ETF | unch. |
| Cross-down | IMTM | iShares MSCI Intl Momentum Factor ETF | -0.49% |
| Cross-down | SPYG | S&P 500 Growth ETF | -0.57% |
| Cross-down | QQQ | Invesco QQQ | -1.02% |
| Cross-down | IWF | iShares Russell 1000 Growth ETF | -1.25% |
Fixed Income vs AGG: Price Ratio vs 20-day MA
| Signal | Ticker | Name | 20D rel perf |
|---|---|---|---|
| Cross-up | TIP | iShares TIPS Bond ETF | +0.20% |
| Cross-down | PFF | iShares Preferred and Income Securities ETF | -1.17% |
Specialty: Price vs 20-day MA
| Signal | Ticker | Name | 20D perf |
|---|---|---|---|
| Cross-down | FTLS | First Trust Long/Short Equity ETF | -0.22% |
| Cross-down | JEPQ | JPMorgan Nasdaq Equity Premium Income ETF | -0.83% |
| Cross-down | ICLN | iShares Global Clean Energy ETF | -3.57% |
| Cross-down | MTUM | iShares MSCI USA Momentum Factor ETF | -5.52% |
| Cross-down | SMH | VanEck Semiconductor ETF | -7.88% |
Specialty vs SPY: Price Ratio vs 20-day MA
| Signal | Ticker | Name | 20D rel perf |
|---|---|---|---|
| Cross-up | USMV | iShares MSCI USA Min Vol Factor ETF | +1.09% |
| Cross-down | ICLN | iShares Global Clean Energy ETF | -1.61% |
| Cross-down | MTUM | iShares MSCI USA Momentum Factor ETF | -3.60% |
| Cross-down | SMH | VanEck Semiconductor ETF | -6.01% |
Romain Gandon
CEO, Quantlake
Disclaimer: This article is for informational and educational purposes only and does not constitute investment advice. Past performance is not indicative of future results.