
.png)
Tactical Trends: Cyclicals Rejoin as Equities Stay Benchmark-Led
Price participation broadened faster than relative confirmation
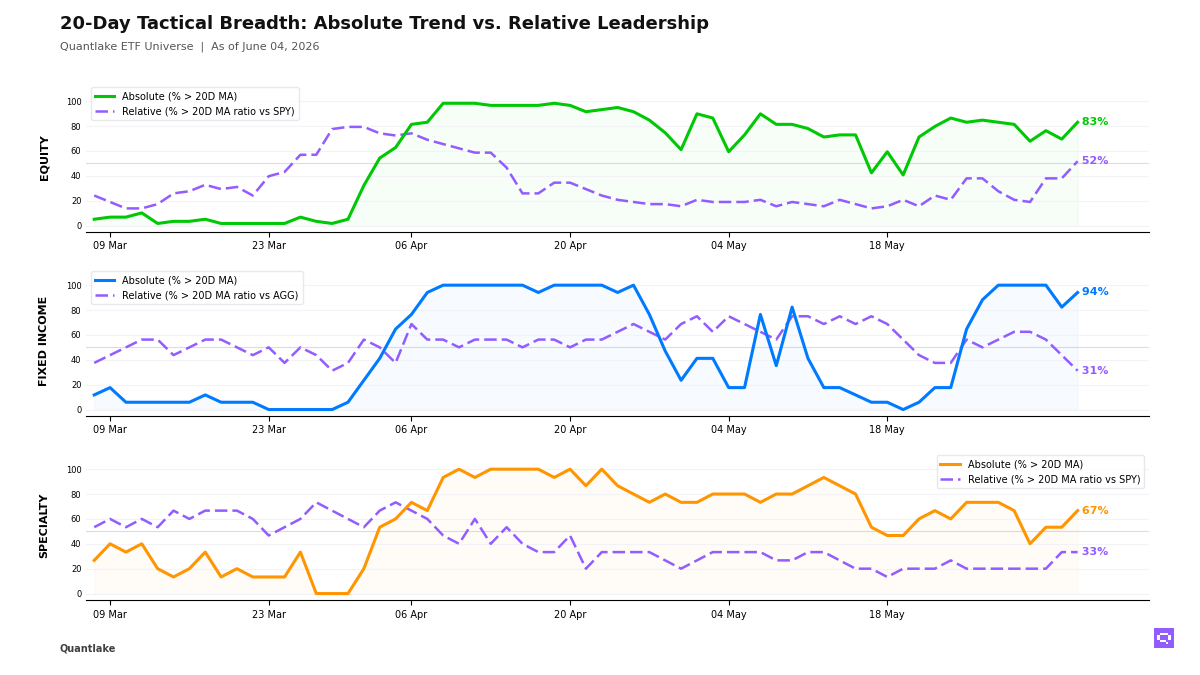
At the close, equity price participation rebounded across our ETF universe, with 49 of 59 ETFs (83%, +13.6pp) above their 20-day moving average and 30 of 58 (52%, +13.8pp) outperforming the S&P 500 SPY. US cyclicals, smaller caps, Asia-Pacific equity, and selective healthcare drove that expansion, with Dow Jones DIA and Healthcare XLV moving into relative leadership. The +31pp gap between absolute and relative breadth keeps equities in a benchmark-led regime rather than a fully shared advance.
In fixed income, price participation broadened even as internal leadership weakened, with 16 of 17 ETFs (94%, +11.8pp) above their 20-day moving average but only 5 of 16 (31%, -12.5pp) outperforming the Aggregate Bonds AGG. Credit, munis, and long duration carried the relative side as Treasuries, mortgages, and international aggregate lagged, leaving bonds in a strongly benchmark-led configuration with a +63pp abs/rel gap.
Specialty price recovery widened, but only a narrow group beat the S&P 500 SPY, with semiconductors, momentum, and clean energy leading while biotech, real estate, crypto proxies, and precious metals failed to confirm. In commodities, Copper CPER improved on a relative basis versus the S&P 500 SPY as Oil USO fell below its 20-day moving average, leaving specialty and commodities in a selective rotation rather than a coordinated cyclical phase.
20-Day Tactical Breadth
Key Takeaways
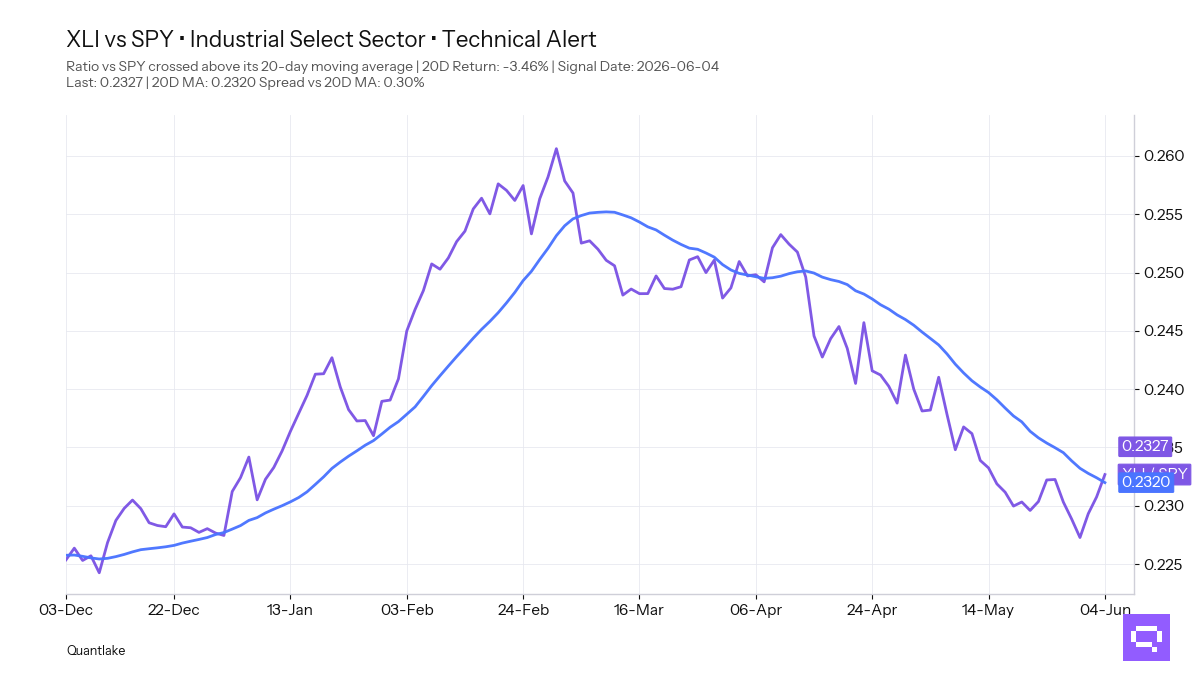
• Industrials XLI with a -3.46% period relative return versus SPY crossed above its 20-day ratio moving average. That move sits in the same early repair cluster as Small-Cap IJR, Russell 2000 IWM, and Intl Momentum IMTM, where the ratio break improved but trailing 20-day relative performance remained negative. We keep the deeper cross-timescale leadership concentrated in US growth and Asia exporters, so the equity rotation broadened without displacing the established leaders.
• Fixed income split internally rather than moving in one direction. Global Bonds BNDX and Mortgage-Backed MBB crossed below their ratio moving averages versus Aggregate Bonds AGG. 3-7yr Treasuries IEI and Int. Treasuries VGIT moved back above their 20-day moving averages in price. That mix marks rate-sensitive stabilization with benchmark outperformance confined to selective credit, munis, EM debt, and long duration.
• Biotechnology IBB and Real Estate VNQ moved back above their 20-day moving averages. They stayed in the divergent group that recovered in price without beating the S&P 500 SPY. Semiconductors SMH, momentum, and clean energy held the cleaner relative leadership profile across specialty. In commodities, Copper CPER crossed above its 20-day ratio moving average versus the S&P 500 SPY. Oil USO crossed below its 20-day moving average. The commodity tape stayed split rather than unified across inflation-sensitive exposure.
FEATURED ETF — Industrial Select Sector XLI vs SPY
Other Technical Signal Events
EQUITY
↗ Price breakouts (cross-up 20D MA)
• EWU - iShares MSCI United Kingdom ETF · 20D perf: -1.18%
• IQLT - iShares MSCI Intl Quality Factor ETF · -1.02%
• EWG - iShares MSCI Germany ETF · -0.92%
• XLRE - SPDR Real Estate Select ETF · -0.76%
• JEPI - JPMorgan Equity Premium Income ETF · -0.67%
• VGK - Vanguard FTSE Europe · -0.38%
• XLF - Financial Select Sector · +0.68%
• ACWV - iShares MSCI Global Min Vol Factor ETF · +0.74%
↘ Price breakdowns (cross-down 20D MA)
None on the close
↗ Leadership gains (cross-up 20D MA vs SPY)
• XLI - Industrial Select Sector · 20D relative perf: -3.46%
• SLYG - SPDR® S&P 600 Small Cap Growth ETF · -2.98%
• IJR - iShares Core S&P Small-Cap ETF · -2.14%
• IMTM - iShares MSCI Intl Momentum Factor ETF · -1.86%
• IWM - iShares Russell 2000 ETF · -1.31%
• URTH - iShares MSCI World ETF · -0.64%
• DIA - SPDR Dow Jones Industrial Average ETF · +0.41%
• XLV - Health Care Select Sector · +1.38%
↘ Leadership losses (cross-down 20D MA vs SPY)
None on the close
FIXED INCOME
↗ Price breakouts (cross-up 20D MA)
• VGIT - Vanguard Intermediate-Term Treasury · 20D perf: -0.45%
• IEI - iShares 3-7 Year Treasury Bond ETF · -0.43%
↘ Price breakdowns (cross-down 20D MA)
None on the close
↗ Leadership gains (cross-up 20D MA vs AGG)
None on the close
↘ Leadership losses (cross-down 20D MA vs AGG)
• BNDX - Vanguard Total International Bond · 20D relative perf: +0.27%
• MBB - iShares MBS ETF · unch.
SPECIALTY
↗ Price breakouts (cross-up 20D MA)
• IBB - iShares Biotechnology ETF · 20D perf: -1.40%
• VNQ - Vanguard Real Estate ETF · -1.02%
↘ Price breakdowns (cross-down 20D MA)
None on the close
↗ Leadership gains (cross-up 20D MA vs SPY)
None on the close
↘ Leadership losses (cross-down 20D MA vs SPY)
None on the close
COMMODITIES
↗ Price breakouts (cross-up 20D MA)
None on the close
↘ Price breakdowns (cross-down 20D MA)
• USO - United States Oil Fund LP · 20D perf: +2.08%
↗ Leadership gains (cross-up 20D MA vs SPY)
• CPER - United States Copper LP · 20D relative perf: +2.58%
↘ Leadership losses (cross-down 20D MA vs SPY)
None on the close
Romain Gandon
CEO, Quantlake
Disclaimer: This article is for informational and educational purposes only and does not constitute investment advice. Past performance is not indicative of future results.


