
.png)
Tactical Trends: Bonds Rebound, Equity Leadership Narrows
Price breadth repaired faster than benchmark-relative leadership
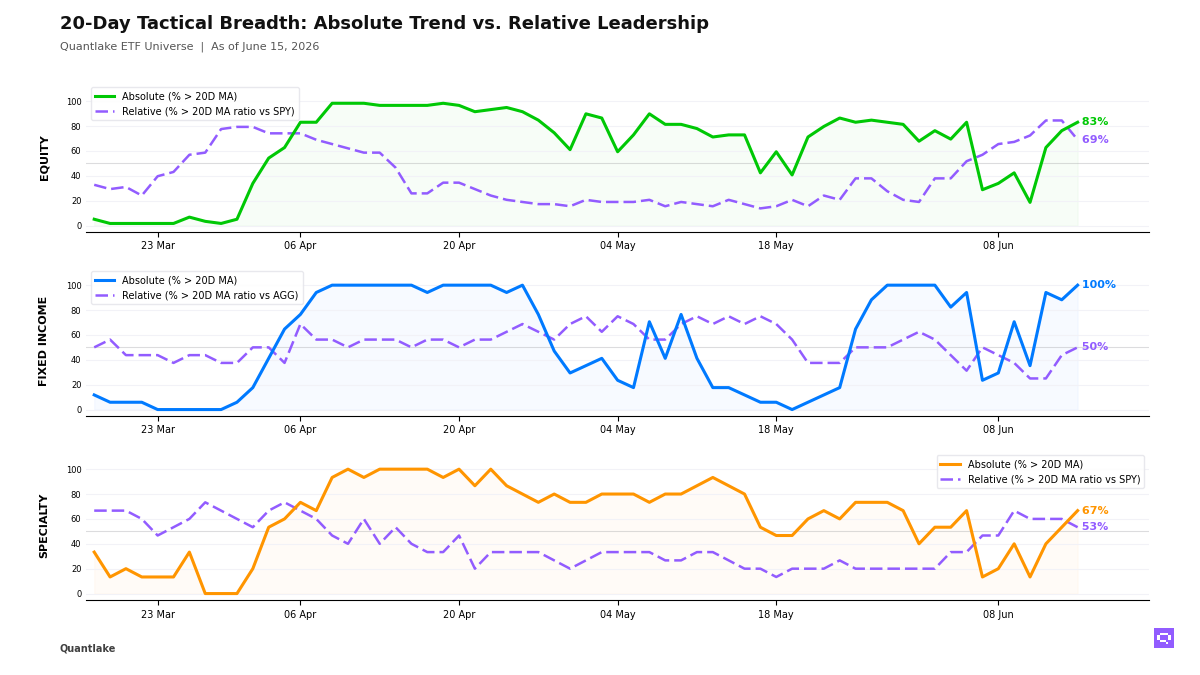
As of June 15, fixed income breadth sits at 17 of 17 ETFs (100%, +11.8pp) above their 20-day moving average (20D MA); only 8 of 16 (50%, +6.2pp) sit above their 20-day ratio moving average vs Aggregate Bonds AGG (20D ratio MA vs AGG). EM debt, credit, mortgages, munis and long duration define the relative winners, while Treasuries, short duration and TIPS lag; the bucket carries a +50pp absolute-relative gap. The bond move is a benchmark-led rebound rather than a uniform relative advance.
Equity breadth across our ETF universe sits at 49 of 59 ETFs (83%, +6.8pp) above their 20D MA; only 40 of 58 (69%, -15.5pp) sit above their 20D ratio MA vs S&P 500 SPY. U.S. cyclicals, small caps, Asia and factor leadership define the relative winners, while China, Germany, low-volatility and dividend-income exposures lag; United Kingdom equity, utilities and U.S. income exposures sit above their 20D MA without relative confirmation. The equity advance is broad in price, but leadership concentrates away from defensive and income-heavy exposures.
Specialty breadth fits a breadth trap, with 10 of 15 ETFs (67%, +13.3pp) above their 20D MA and 8 of 15 (53%, -6.7pp) above their 20D ratio MA vs S&P 500 SPY; semiconductors, biotech, momentum, real estate and gold miners lead, while spot gold, bitcoin proxies, clean energy and alternative diversifiers lag. Commodities posted no fresh cross signals, but copper holds the only aligned leadership in that bucket, while agriculture and silver lag on a relative basis. The cross-asset mix favors selective recovery over uniform confirmation.
20-Day Tactical Breadth
Key Takeaways
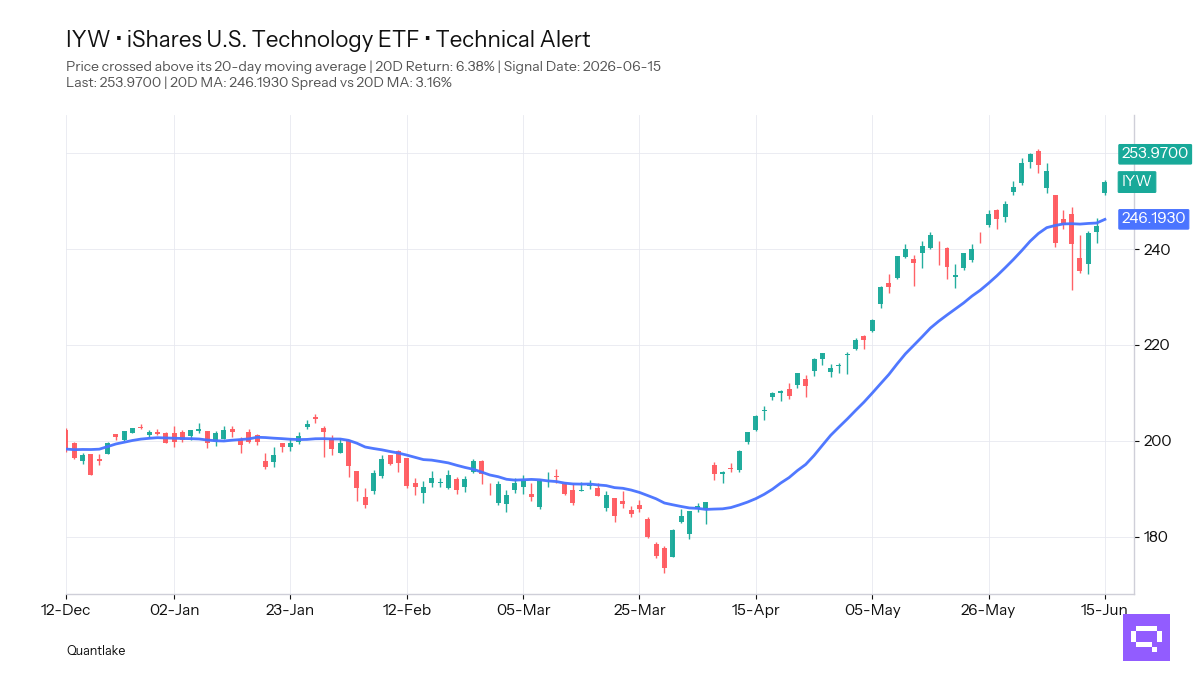
US Technology IYW, a Broad Technology exposure, crossed above its 20D MA on a +6.38% period return. Nasdaq 100 QQQ also crossed above its 20D MA after a +4.95% 20-day return. S&P Growth SPYG crossed above its 20D ratio MA vs S&P 500 SPY after a -0.52% relative lookback. The growth repair is stronger in price than in benchmark-relative quality.
Preferred Stock PFF crossed above its 20D MA and above its 20D ratio MA vs Aggregate Bonds AGG, but its relative lookback sat at -0.51%. Core aggregate, Treasuries, short duration, and TIPS sit above their 20D MA without matching benchmark-relative strength. The bond rebound favors credit and selective duration rather than a full duration-wide leadership shift.
Gold Miners GDX crossed above its 20D MA and its 20D ratio MA vs S&P 500 SPY even though its relative lookback sat at -4.41%. Long/Short Equity FTLS crossed above its 20D MA, but its ratio slipped below its 20D ratio MA vs benchmark on a -1.44% relative lookback. Min Volatility USMV also lagged. Specialty leadership is selective, with miners repairing first and defensive alternatives failing to confirm.
FEATURED ETF: iShares U.S. Technology ETF IYW
Other Technical Signal Events
EQUITY
↗ Price breakouts (cross-up 20D MA)
SPYG - SPDR® Portfolio S&P 500 Growth ETF · 20D perf: +1.59%
XLY - Consumer Discretionary Select Sector · +1.75%
URTH - iShares MSCI World ETF · +2.54%
VTI - Vanguard Total Stock Market · +2.70%
QQQ - Invesco QQQ · +4.95%
IYW - iShares U.S. Technology ETF · +6.38%
↘ Price breakdowns (cross-down 20D MA)
ACWV - iShares MSCI Global Min Vol Factor ETF · 20D perf: +0.70%
IDV - iShares International Select Dividend ETF · -0.26%
EFAV - iShares MSCI EAFE Min Vol Factor ETF · -2.21%
↗ Leadership gains (cross-up 20D MA vs SPY)
SPYG - SPDR® Portfolio S&P 500 Growth ETF · 20D relative perf: -0.52%
↘ Leadership losses (cross-down 20D MA vs SPY)
VYM - Vanguard High Dividend Yield · 20D relative perf: +0.88%
SCHD - Schwab U.S. Dividend Equity ETF · +0.79%
EWU - iShares MSCI United Kingdom ETF · +0.72%
SPYV - SPDR® Portfolio S&P 500 Value ETF · +0.61%
URTH - iShares MSCI World ETF · +0.41%
XLU - Utilities Select Sector · -0.13%
JEPI - JPMorgan Equity Premium Income ETF · -0.54%
ACWV - iShares MSCI Global Min Vol Factor ETF · -1.39%
IDV - iShares International Select Dividend ETF · -2.33%
EFAV - iShares MSCI EAFE Min Vol Factor ETF · -4.23%
FIXED INCOME
↗ Price breakouts (cross-up 20D MA)
VTIP - Vanguard Short-Term Inflation-Protected Securities · 20D perf: unch.
PFF - iShares Preferred and Income Securities ETF · +0.67%
↘ Price breakdowns (cross-down 20D MA)
None on the close
↗ Leadership gains (cross-up 20D MA vs AGG)
PFF - iShares Preferred and Income Securities ETF · 20D relative perf: -0.51%
↘ Leadership losses (cross-down 20D MA vs AGG)
None on the close
SPECIALTY
↗ Price breakouts (cross-up 20D MA)
GDX - VanEck Gold Miners ETF · 20D perf: -2.38%
FTLS - First Trust Long/Short Equity ETF · +0.65%
↘ Price breakdowns (cross-down 20D MA)
None on the close
↗ Leadership gains (cross-up 20D MA vs SPY)
GDX - VanEck Gold Miners ETF · 20D relative perf: -4.41%
↘ Leadership losses (cross-down 20D MA vs SPY)
USMV - iShares MSCI USA Min Vol Factor ETF · 20D relative perf: -0.38%
FTLS - First Trust Long/Short Equity ETF · -1.44%
COMMODITIES
No event on the close
Romain Gandon
CEO, Quantlake
Disclaimer: This article is for informational and educational purposes only and does not constitute investment advice. Past performance is not indicative of future results.


