.png)
Tactical Trends: Bond Rebound Stays Benchmark-Led as Equity Repairs
Price repair broadened faster than relative confirmation
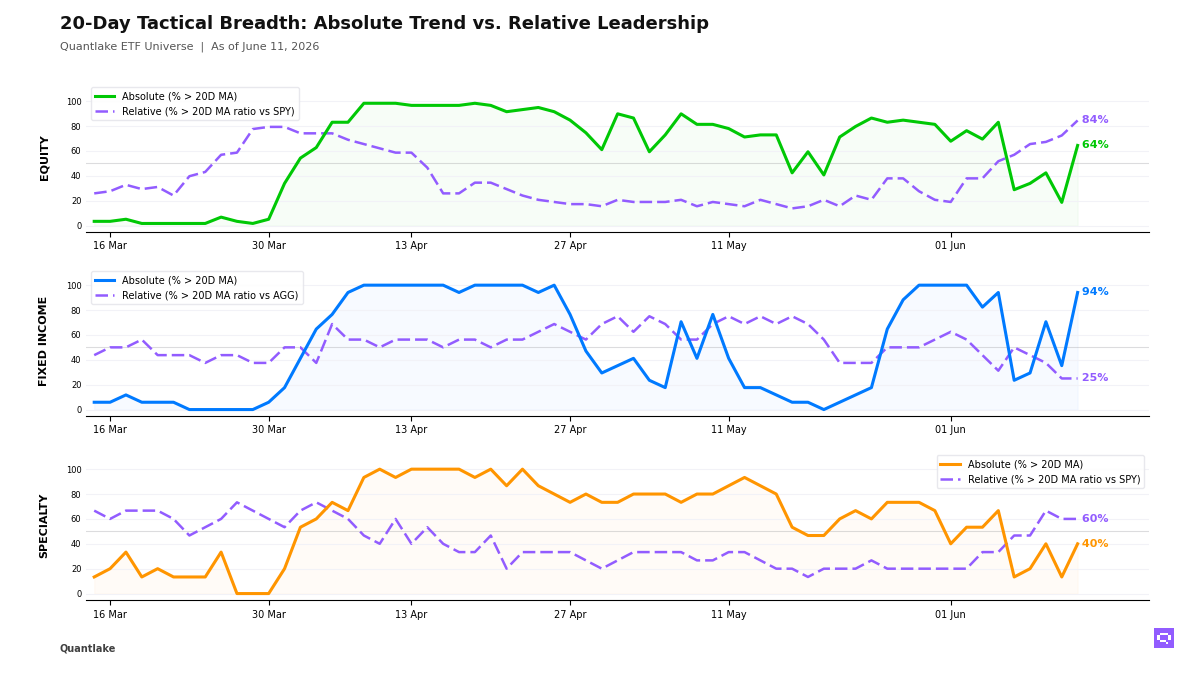
Fixed income holds the largest price-relative split at the close, with 16 of 17 bond ETFs (94%, +58.8pp) above their 20-day moving average (20D MA) and only 4 of 16 outperforming the Aggregate Bonds AGG (25%, unchanged), a 69pp gap. Long duration and select spread sectors lead, with Investment Grade Credit LQD among the relative winners, whereas high yield, intermediate Treasuries, munis, and short duration sit above their 20D MA without beating the benchmark. The bond move is a broad price rebound with leadership confined to duration and select spread sectors.
Equity breadth moved higher across our universe, with 38 of 59 equity ETFs (64%, +45.8pp) above their 20D MA and 49 of 58 outperforming the S&P 500 SPY (84%, +12.1pp). Small caps, dividend and value tilts, developed ex-US, and Asia carry the leaders, but US growth, China, and Brazil remain below their 20D MA in key pockets of our coverage. Relative leadership is broadening faster than absolute repair in equities.
Specialty participation sits at 6 of 15 ETFs (40%, +26.7pp) above their 20D MA and 9 of 15 outperforming the S&P 500 SPY (60%, unchanged), with semiconductors, infrastructure, real estate, biotech, and momentum leading, while managed futures, gold-linked exposures, and bitcoin-linked exposures lag the benchmark. Copper CPER also sits above its 20D MA and above its 20-day ratio moving average vs S&P 500 SPY (20D ratio MA vs SPY), while silver and agriculture remain the weaker commodity pockets. The cross-asset mix favors selective cyclicality rather than uniform confirmation.
20-Day Tactical Breadth
Key Takeaways
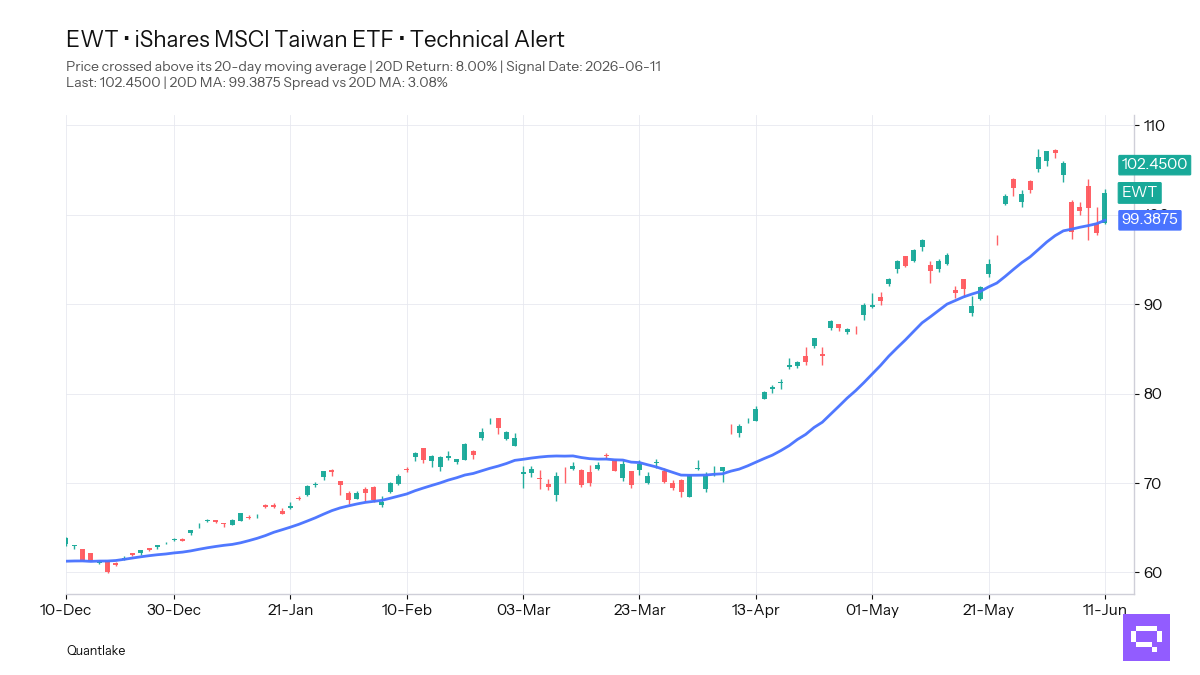
• Taiwan EWT, with a +8.00% period return, crossed above its 20-day moving average. Taiwan, South Korea, emerging markets, and US small- and mid-cap exposure also hold cross-timescale relative leadership versus the S&P 500 SPY, so the equity leadership cluster is Asia and cyclically tilted domestic beta.
• Long duration, EM debt, Investment Grade Credit LQD, and mortgage-backed securities hold the cross-timescale relative leader set versus the Aggregate Bonds AGG. Intermediate Treasuries and short duration remain the weaker relative pockets, so the fixed-income rebound is a duration-and-spread rotation rather than a uniform bond move.
• Momentum Factor MTUM, Infrastructure PAVE, and Semiconductors SMH hold daily, weekly, and monthly alignment. Managed Futures DBMF lost relative strength versus the S&P 500 SPY. Copper CPER improved in both price and ratio terms, but its 20-day return stayed at -3.30%. Commodity leadership is concentrated in equity-linked cyclicals rather than diversifiers.
FEATURED ETF — iShares MSCI Taiwan ETF EWT
Other Technical Signal Events
EQUITY
↗ Price breakouts (cross-up 20D MA)
• XLB - Materials Select Sector · 20D perf: -1.61%
• EWJ - iShares MSCI Japan ETF · -0.98%
• IMTM - iShares MSCI Intl Momentum Factor ETF · -0.41%
• EFAV - iShares MSCI EAFE Min Vol Factor ETF · unch.
• EWU - iShares MSCI United Kingdom ETF · unch.
• IVLU - iShares Edge MSCI Intl Value Factor ETF · +0.14%
• EEM - iShares MSCI Emerging Markets ETF · +0.43%
• JEPI - JPMorgan Equity Premium Income ETF · +0.47%
• ACWV - iShares MSCI Global Min Vol Factor ETF · +0.82%
• EFA - iShares MSCI EAFE ETF · +0.87%
• XLI - Industrial Select Sector · +0.88%
• VEA - Vanguard FTSE Developed Markets · +0.96%
• IQLT - iShares MSCI Intl Quality Factor ETF · +1.03%
• SPYV - SPDR® Portfolio S&P 500 Value ETF · +1.11%
• VGK - Vanguard FTSE Europe · +2.12%
• MDYG - SPDR® S&P 400 Mid Cap Growth ETF · +2.13%
• VYM - Vanguard High Dividend Yield · +2.19%
• QUAL - iShares MSCI USA Quality Factor ETF · +2.34%
• SCHD - Schwab U.S. Dividend Equity ETF · +2.46%
• DIA - SPDR Dow Jones Industrial Average ETF · +2.51%
• VIG - Vanguard Dividend Appreciation · +2.54%
• VO - Vanguard Mid-Cap · +2.61%
• IWM - iShares Russell 2000 ETF · +2.74%
• VB - Vanguard Small-Cap · +3.03%
• EWY - iShares MSCI South Korea ETF · +5.47%
• VLUE - iShares MSCI USA Value Factor ETF · +7.46%
• EWT - iShares MSCI Taiwan ETF · +8.00%
↘ Price breakdowns (cross-down 20D MA)
None on the close
↗ Leadership gains (cross-up 20D MA vs SPY)
• EWJ - iShares MSCI Japan ETF · 20D relative perf: -0.37%
• IMTM - iShares MSCI Intl Momentum Factor ETF · +0.20%
• EWG - iShares MSCI Germany ETF · +0.88%
• QQQ - Invesco QQQ · +0.96%
• EEM - iShares MSCI Emerging Markets ETF · +1.05%
• IYW - iShares U.S. Technology ETF · +1.74%
• XLK - Technology Select Sector · +4.24%
• EWY - iShares MSCI South Korea ETF · +6.12%
↘ Leadership losses (cross-down 20D MA vs SPY)
• XLE - Energy Select Sector · 20D relative perf: -0.15%
FIXED INCOME
↗ Price breakouts (cross-up 20D MA)
• TIP - iShares TIPS Bond ETF · 20D perf: -0.22%
• VTIP - Vanguard Short-Term Inflation-Protected Securities · -0.18%
• IEI - iShares 3-7 Year Treasury Bond ETF · +0.12%
• VGIT - Vanguard Intermediate-Term Treasury · +0.18%
• VCIT - Vanguard Intermediate-Term Corporate Bond · +0.35%
• IEF - iShares 7-10 Year Treasury Bond ETF · +0.36%
• HYG - iShares iBoxx $ High Yield Corporate Bond ETF · +0.55%
• JNK - SPDR® Bloomberg High Yield Bond ETF · +0.65%
• LQD - iShares iBoxx $ Investment Grade Corporate Bond ETF · +0.80%
• BNDX - Vanguard Total International Bond · +0.82%
↘ Price breakdowns (cross-down 20D MA)
None on the close
↗ Leadership gains (cross-up 20D MA vs AGG)
• LQD - iShares iBoxx $ Investment Grade Corporate Bond ETF · 20D relative perf: +0.25%
↘ Leadership losses (cross-down 20D MA vs AGG)
• MUB - iShares National Muni Bond ETF · 20D relative perf: +0.11%
SPECIALTY
↗ Price breakouts (cross-up 20D MA)
• IBB - iShares Biotechnology ETF · 20D perf: -1.25%
• PAVE - Global X U.S. Infrastructure Development ETF · +1.26%
• MTUM - iShares MSCI USA Momentum Factor ETF · +4.46%
• SMH - VanEck Semiconductor ETF · +6.46%
↘ Price breakdowns (cross-down 20D MA)
None on the close
↗ Leadership gains (cross-up 20D MA vs SPY)
• JEPQ - JPMorgan Nasdaq Equity Premium Income ETF · 20D relative perf: +0.88%
↘ Leadership losses (cross-down 20D MA vs SPY)
• DBMF - iMGP DBi Managed Futures Strategy ETF · 20D relative perf: -0.61%
COMMODITIES
↗ Price breakouts (cross-up 20D MA)
• CPER - United States Copper LP · 20D perf: -3.30%
↘ Price breakdowns (cross-down 20D MA)
None on the close
↗ Leadership gains (cross-up 20D MA vs SPY)
• CPER - United States Copper LP · 20D relative perf: -2.71%
↘ Leadership losses (cross-down 20D MA vs SPY)
None on the close
Romain Gandon
CEO, Quantlake
Disclaimer: This article is for informational and educational purposes only and does not constitute investment advice. Past performance is not indicative of future results.