.png)

Tactical Trends: Asia and Growth Extend Equity's Price Rebound
Price participation improved; SPY-relative leadership stayed narrow.
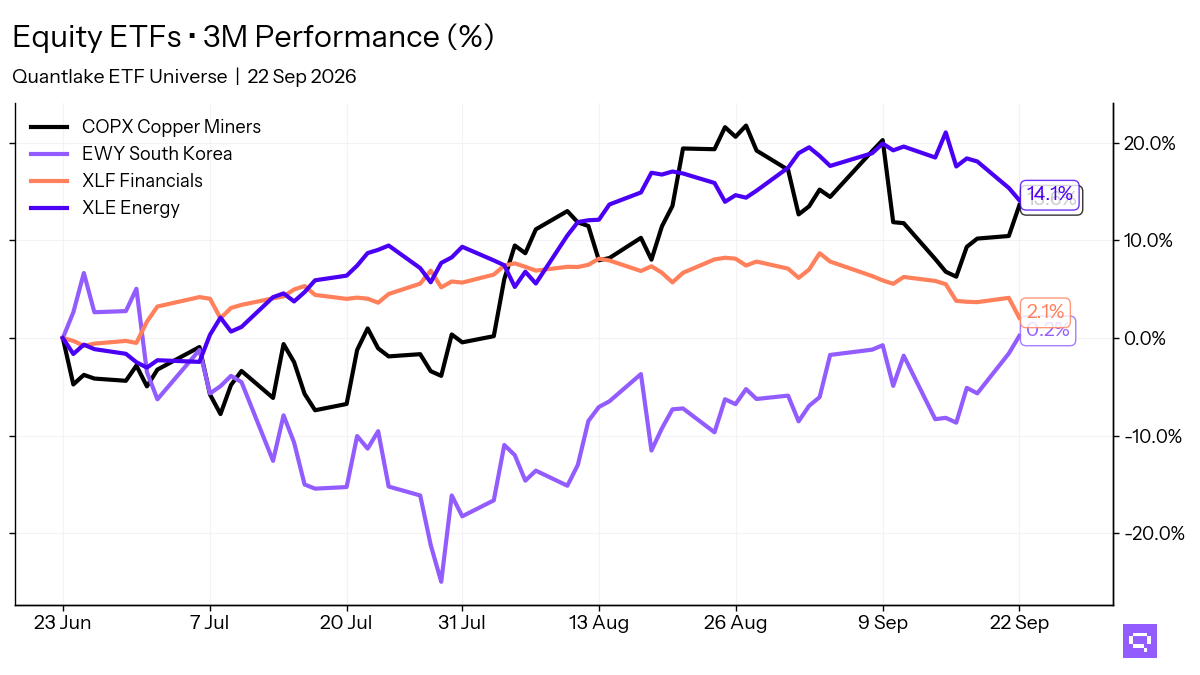
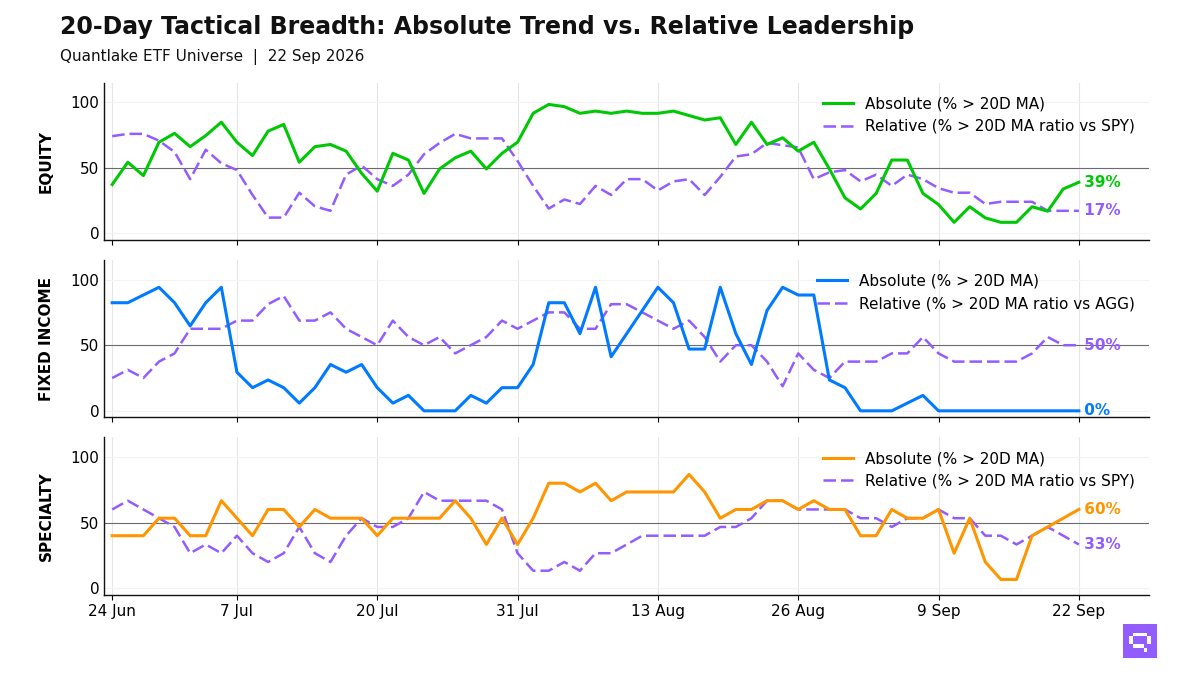
Equity price participation improved into the September 22 close, led by emerging markets, Asia-Pacific equity, and US growth. 23 of 59 equity ETFs (39%, +5.1pp on the day) hold above their 20-day averages. Only 10 of 58 outperform the S&P 500 SPY on the same basis (17%, unchanged). The 22pp price-relative gap leaves price participation ahead of leadership. Low-volatility, developed ex-US value, and small-cap US equity form the laggard cluster.
The 17-ETF fixed-income bucket is a static snapshot. 0 of 17 bond ETFs hold above their 20-day averages. 8 of 16 outperform the Aggregate Bonds AGG. The relative winners cluster in credit and international aggregate. Long-duration and short-duration both appear in the winning group. Treasuries, mortgages, and inflation-linked funds lag the benchmark.
The 15-ETF specialty bucket is a static snapshot. Crypto-linked funds, Semiconductors SMH, and Momentum MTUM lead vs the S&P 500 SPY. Managed futures, gold, and real estate lag. Commodities split across signals. Oil USO crossed below its 20-day moving average (20D MA). Silver SLV crossed above its ratio MA vs the S&P 500 SPY.
20-Day Tactical Breadth
Key Takeaways
Japan EWJ crossed above its ratio MA vs the S&P 500 SPY after a 2.57% 20-day return. China Large Cap FXI crossed above its 20-day average after a 1.55% 20-day loss. FXI stays in the divergent bucket, with price above its MA and ratio below its ratio MA.
International Aggregate BNDX and EM Debt EMB populate the bond leader cluster vs Aggregate Bonds AGG, though both remain below their 20-day averages. Cross-timescale alignment reaches 88%. The same relative list spans credit, long-duration, and short-duration exposure.
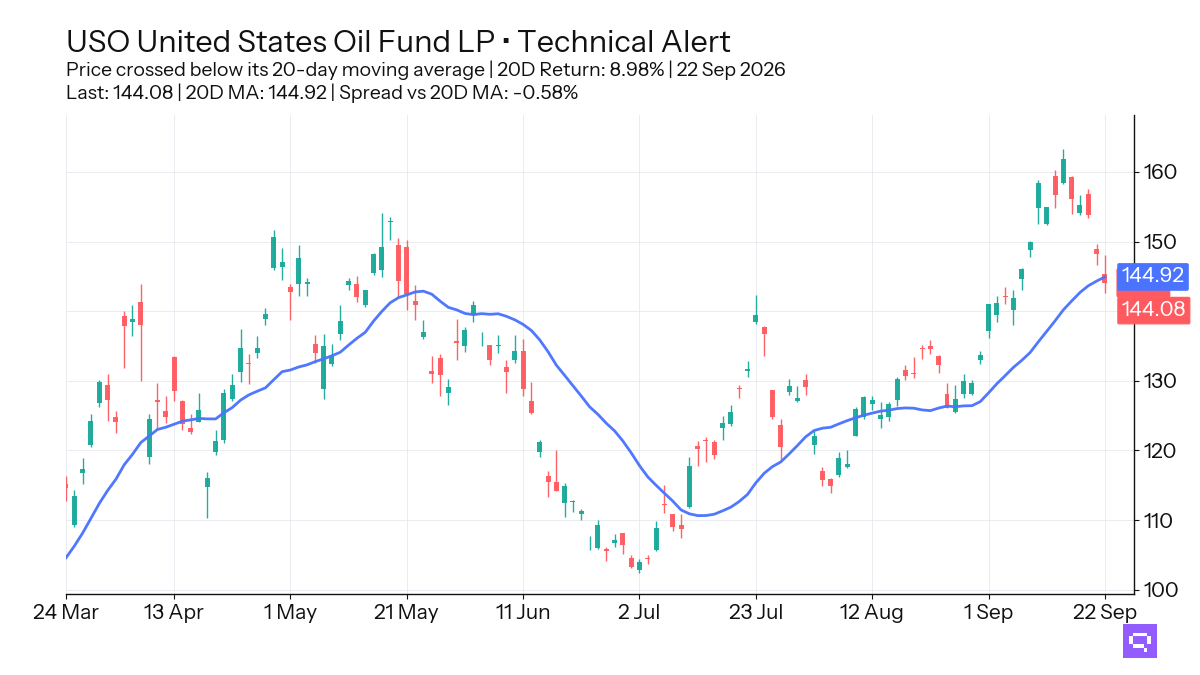
Oil USO, up 8.98% over the trailing 20-day window, crossed below its 20D MA. USO also crossed below its ratio MA vs the S&P 500 SPY after a 7.32% 20-day relative gain. Managed Futures DBMF crossed below its ratio MA vs the S&P 500 SPY after a 0.52% relative gain. Biotechnology IBB crossed above its 20-day average despite a 0.80% 20-day loss.
FEATURED ETF: United States Oil Fund LP USO
Other Technical Signal Events
Equity: Price vs 20-day MA
| Signal | Ticker | Name | 20D perf |
|---|---|---|---|
| Cross-up | XLV | Health Care Select Sector | -2.38% |
| Cross-up | FXI | iShares China Large-Cap ETF | -1.55% |
| Cross-up | VEA | Vanguard FTSE Developed Markets Index ETF | -0.23% |
Equity vs SPY: Price Ratio vs 20-day MA
| Signal | Ticker | Name | 20D rel perf |
|---|---|---|---|
| Cross-up | EWJ | iShares MSCI Japan ETF | +2.57% |
| Cross-down | XLC | Communication Services Select Sector | -0.14% |
Specialty: Price vs 20-day MA
| Signal | Ticker | Name | 20D perf |
|---|---|---|---|
| Cross-up | IBB | iShares Biotechnology ETF | -0.80% |
Specialty vs SPY: Price Ratio vs 20-day MA
| Signal | Ticker | Name | 20D rel perf |
|---|---|---|---|
| Cross-down | DBMF | iMGP DBi Managed Futures Strategy ETF | +0.52% |
Commodities: Price vs 20-day MA
| Signal | Ticker | Name | 20D perf |
|---|---|---|---|
| Cross-down | USO | United States Oil Fund LP | +8.98% |
Commodities vs SPY: Price Ratio vs 20-day MA
| Signal | Ticker | Name | 20D rel perf |
|---|---|---|---|
| Cross-up | SLV | iShares Silver | -3.85% |
| Cross-down | USO | United States Oil Fund LP | +7.32% |
Romain Gandon
CEO, Quantlake
Disclaimer: This article is for informational and educational purposes only and does not constitute investment advice. Past performance is not indicative of future results.