.png)
Tactical Equity Breadth Surges as Leadership Narrows
At the close, we saw equity participation across our ETF universe rebound decisively in price, but leadership stayed concentrated. Across our coverage, 53 of 59 equity ETFs (90%, +28.8pp on the day) held above their 20-day moving average, while only 12 of 58 (21%, +5.2pp) outperformed SPY, leaving a 69pp abs/rel gap and a benchmark-led advance rather than broad confirmation. Price strength now runs through Dev. Markets EFA, Germany EWG, Japan EWJ, India INDA and Emg. Markets EEM, yet the relative winners are still mainly emerging Asia, US small-caps, technology and energy, while low-volatility, developed ex-US, blue-chip US and several international factor exposures remain price recoveries without matching leadership.
In fixed income, we see a defensive rotation rather than a clean duration bid. 7 of 17 fixed income ETFs (41%, +17.6pp on the day) held above their 20-day moving average, but 12 of 16 (75%, +6.2pp) outperformed AGG, with a 34pp inverse gap that keeps the emphasis on EM Sovereign Bonds EMB, High Yield HYG, High Yield Bonds JNK, preferreds, munis and inflation-linked exposure while Treasuries and long duration still lag. Mortgage-Backed MBB and Corp. Credit VCIT also improved versus AGG, whereas Int. Treasuries VGIT slipped on a relative basis, reinforcing that the stronger pocket is spread product and short-duration stability rather than rate-sensitive duration.
Specialty remains a recovery with incomplete confirmation: 11 of 15 ETFs (73%, unchanged on the day) held above their 20-day moving average, but only 4 of 15 (27%, +6.7pp) beat SPY, led by Infrastructure PAVE alongside semiconductors, momentum and clean energy while digital assets, gold and real estate still fail to confirm. In commodities, Copper CPER crossed above its 20-day moving average with a 6.4% 20-day return, while Agriculture Basket DBA fell below its relative 20-day moving average versus SPY with a -5.7% 20-day return.
20-Day Tactical Breadth

Key Takeaways
• Daily, weekly and monthly relative alignment in equity is strongest in emerging markets and US beta: Emg. Markets EEM, Russell 2000 IWM and the technology complex sit in the aligned leader camp, while low-volatility, US dividend and defensive equity, Europe, China and healthcare remain aligned laggards. That multi-horizon split explains why the price rebound looks far healthier than the leadership picture.
• Fixed income is not moving as one block. Cross-timescale leadership sits with EM debt, high yield, preferreds, munis and inflation-linked exposure, while International Aggregate BNDX, Mortgage-Backed MBB, Corp. Credit VCIT and short-duration credit are still below their 20-day moving average even as they outperform AGG, which is a defensive relative-strength pocket rather than outright duration demand.
• Within specialty and commodities, semiconductors and infrastructure are the clearest relative leaders with follow-through beyond the daily window. Copper CPER delivered the strongest absolute 20-day return in this publication at 6.4% as it crossed above its 20-day moving average, while Agriculture Basket DBA's relative break versus SPY keeps the commodity picture uneven.
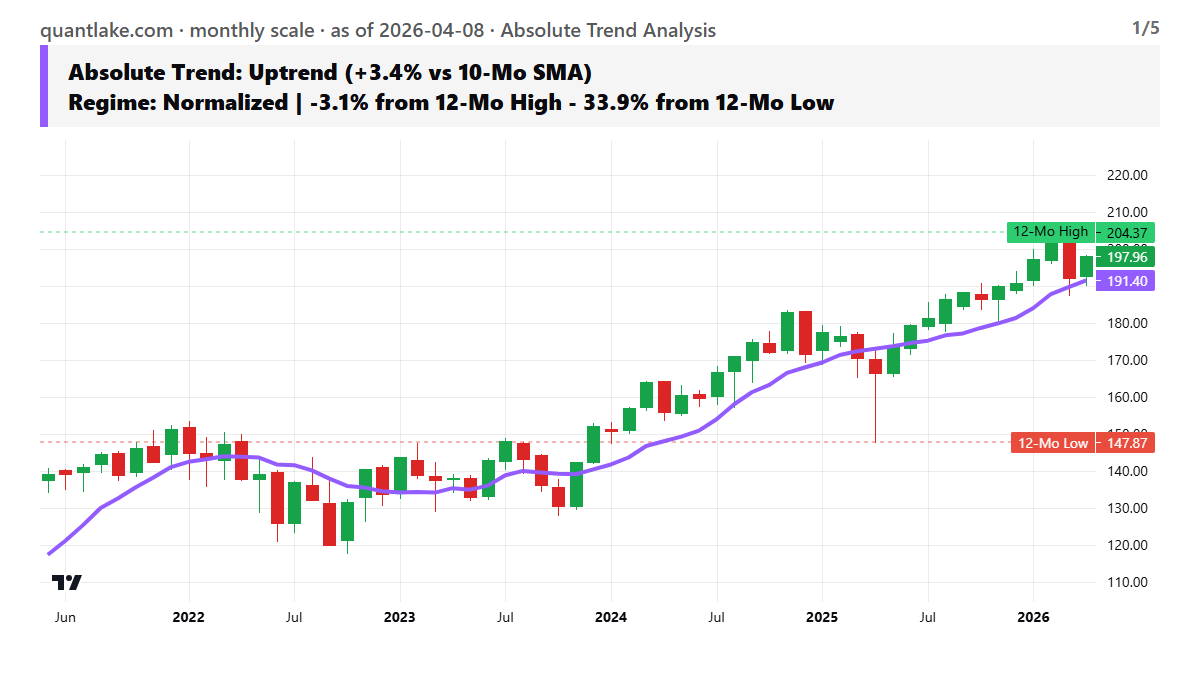
FEATURED ETF — United States Copper LP CPER

Other Technical Signal Events
EQUITY
↗ Price breakouts (cross-up 20D MA)
• ACWV - iShares MSCI Global Min Vol Factor ETF · 20D perf: +1.26%
• XLU - Utilities Select Sector · +1.60%
• JEPI - JPMorgan Equity Premium Income ETF · +2.09%
• MCHI - iShares MSCI China ETF · +2.80%
• EWJ - iShares MSCI Japan ETF · +3.03%
• IVLU - iShares Edge MSCI Intl Value Factor ETF · +3.20%
• FXI - iShares China Large-Cap ETF · +3.46%
• EFA - iShares MSCI EAFE ETF · +3.76%
• IDV - iShares International Select Dividend ETF · +4.10%
• VGK - Vanguard FTSE Europe · +4.21%
• IQLT - iShares MSCI Intl Quality Factor ETF · +4.22%
• XLC - Communication Services Select Sector · +4.74%
• EWG - iShares MSCI Germany ETF · +5.12%
• IMTM - iShares MSCI Intl Momentum Factor ETF · +5.27%
• VEA - Vanguard FTSE Developed Markets · +5.62%
• INDA - iShares MSCI India ETF · +5.80%
• XLI - Industrial Select Sector · +6.17%
↘ Price breakdowns (cross-down 20D MA)
None on the close
↗ Leadership gains (cross-up 20D MA vs SPY)
• SCHD - Schwab U.S. Dividend Equity ETF · 20D relative perf: -4.16%
• SLYG - SPDR® S&P 600 Small Cap Growth ETF · +0.83%
• IWM - iShares Russell 2000 ETF · +1.55%
• EEM - iShares MSCI Emerging Markets ETF · +1.94%
↘ Leadership losses (cross-down 20D MA vs SPY)
• IWF - iShares Russell 1000 Growth ETF · 20D relative perf: +1.13%
FIXED INCOME
↗ Price breakouts (cross-up 20D MA)
• HYG - iShares iBoxx $ High Yield Corporate Bond ETF · 20D perf: +1.27%
• JNK - SPDR® Bloomberg High Yield Bond ETF · +1.42%
• EMB - iShares J.P. Morgan USD Emerging Markets Bond ETF · +2.07%
↘ Price breakdowns (cross-down 20D MA)
None on the close
↗ Leadership gains (cross-up 20D MA vs AGG)
• MBB - iShares MBS ETF · 20D relative perf: unch.
• VCIT - Vanguard Intermediate-Term Corporate Bond · +0.30%
↘ Leadership losses (cross-down 20D MA vs AGG)
• VGIT - Vanguard Intermediate-Term Treasury · 20D relative perf: -0.13%
SPECIALTY
↗ Price breakouts (cross-up 20D MA)
None on the close
↘ Price breakdowns (cross-down 20D MA)
None on the close
↗ Leadership gains (cross-up 20D MA vs SPY)
• PAVE - Global X U.S. Infrastructure Development ETF · 20D relative perf: +0.17%
↘ Leadership losses (cross-down 20D MA vs SPY)
None on the close
COMMODITIES
↗ Price breakouts (cross-up 20D MA)
• CPER - United States Copper LP · 20D perf: +6.38%
↘ Price breakdowns (cross-down 20D MA)
None on the close
↗ Leadership gains (cross-up 20D MA vs SPY)
None on the close
↘ Leadership losses (cross-down 20D MA vs SPY)
• DBA - Invesco DB Agriculture · 20D relative perf: -5.70%
Romain Gandon
CEO, Quantlake
Disclaimer: This report is for informational and educational purposes only and does not constitute investment advice.