.png)
Sector Rotation: Staples Lead as Dispersion Turns Low
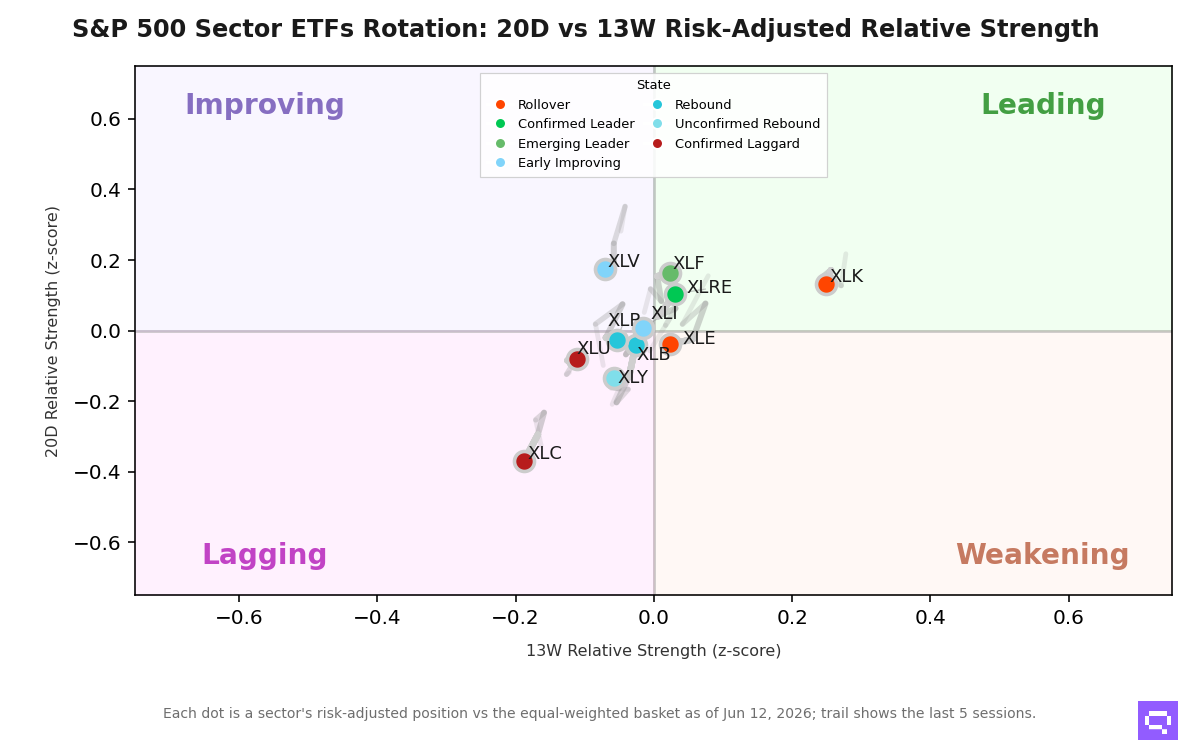
Technology XLK rolled over as Consumer Staples XLP rebounded off the lagging base.
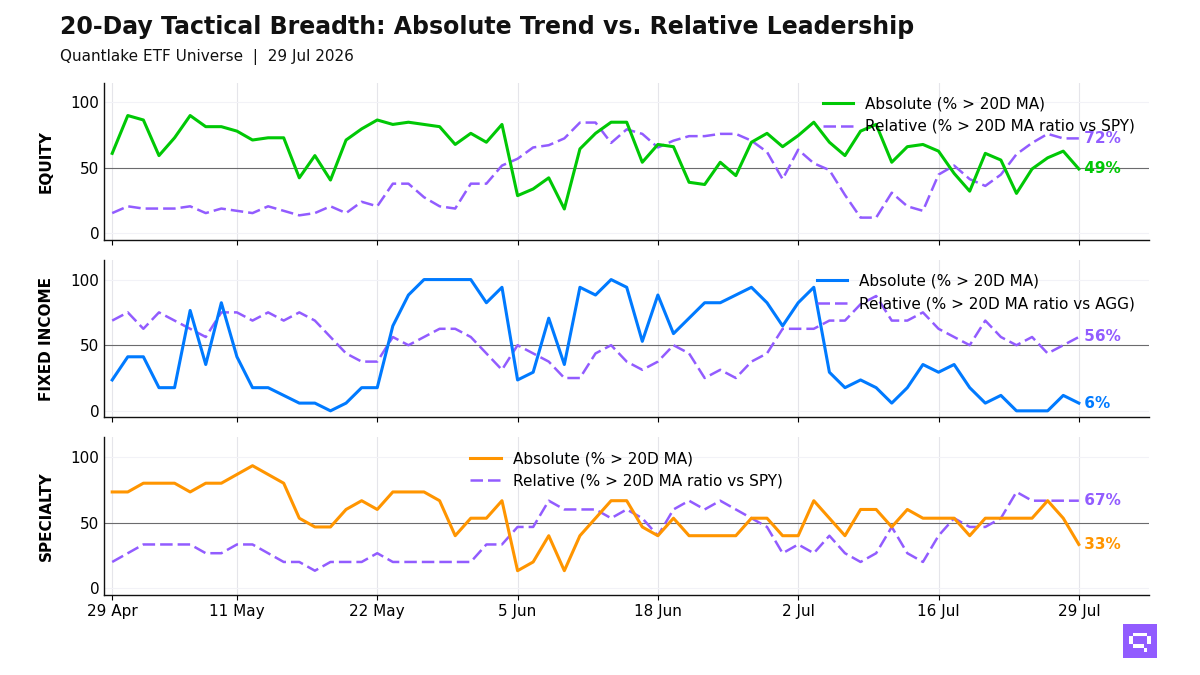
As of June 12, US equity sector dispersion sits in a transitional-low regime, with correlations rising and sector-selection edge narrowing toward a beta-driven tape. The cross-sectional standard deviation of returns across the eleven S&P 500 sector ETFs sat at a -1.16 z-score against its GARCH-normalized mean. Dispersion velocity at -4.86, the 5-session change, showed the spread narrowed sharply over the past five sessions.
Consumer Staples XLP leads the cross-section this week at +0.28 on the 5-day horizon, with 20-day relative strength at -0.03 and 13-week at -0.05. Its tail ran up and right over the week from a lagging base. Technology XLK ranks fourth this week at +0.09 and holds +0.13 on the 20-day horizon and +0.25 on the 13-week horizon in the Leading quadrant. XLK ran the steepest down-tail on the board, slipping one rank from its 20-day standing; the 13-week intermediate lead holds. The weekly baton shifted from the prior anchor to rebound candidates.
Financial XLF, Real Estate XLRE, and Materials XLB swept up over the week, with XLF third at +0.11, XLRE sixth at -0.02, and XLB second at +0.18. Energy XLE, Health Care XLV, and Communication Services XLC slid the other way, with XLE tenth at -0.20 and XLC eleventh at -0.36. Five of eleven sectors carry positive current-week readings. The field clusters around rebounds rather than durable leadership.
XLK's rollover inside the Leading quadrant and XLF's push beside XLRE leave the cross-section favoring fresh rotation over entrenched leadership; the read holds if the up-sweep carries onto the 13-week line and breaks if XLP and XLB fail to lift out of the Lagging quadrant.
Sector Rotation Map
Romain Gandon
CEO, Quantlake
Disclaimer: This article is for informational and educational purposes only and does not constitute investment advice. Past performance is not indicative of future results.