.png)
Sector Rotation: Health Care Leads the Weekly Tape
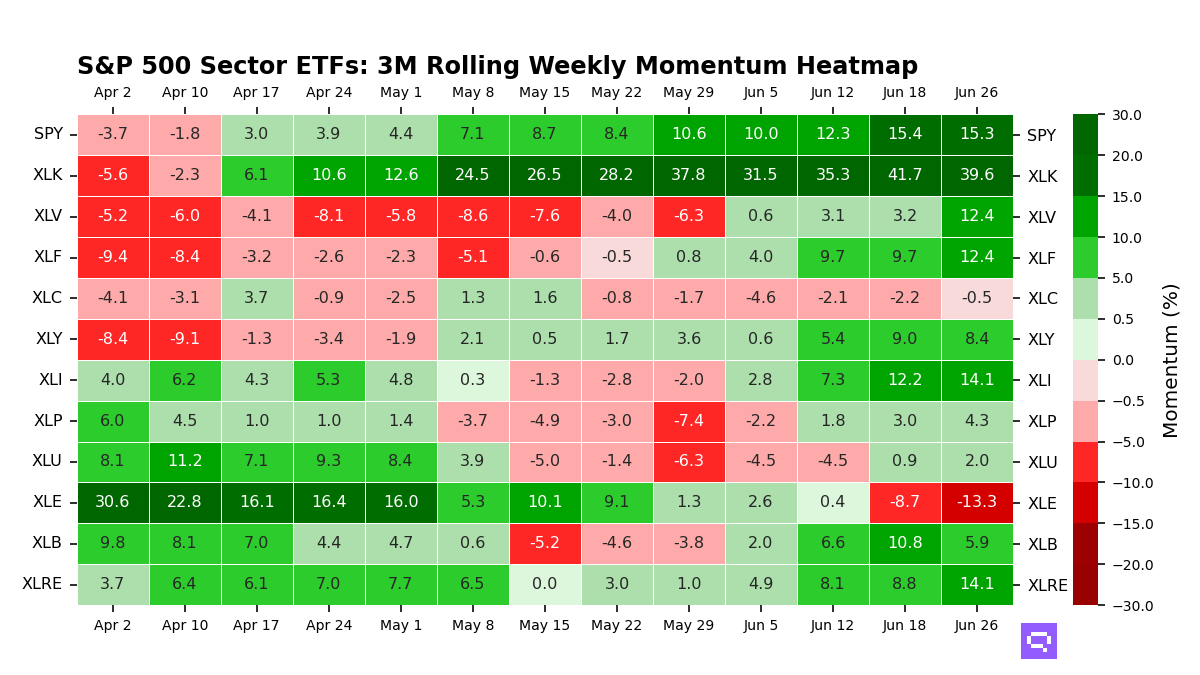
Technology XLK rolled over and Health Care XLV emerged atop the weekly table.
As of June 26, dispersion across the eleven S&P 500 sector ETFs sits in a normal regime. The z-score against its GARCH-normalised mean is +0.74, and the spread widened marginally over the past five sessions. The configuration is a selection tape, with the spread near average and the motion dispersed across cohorts.
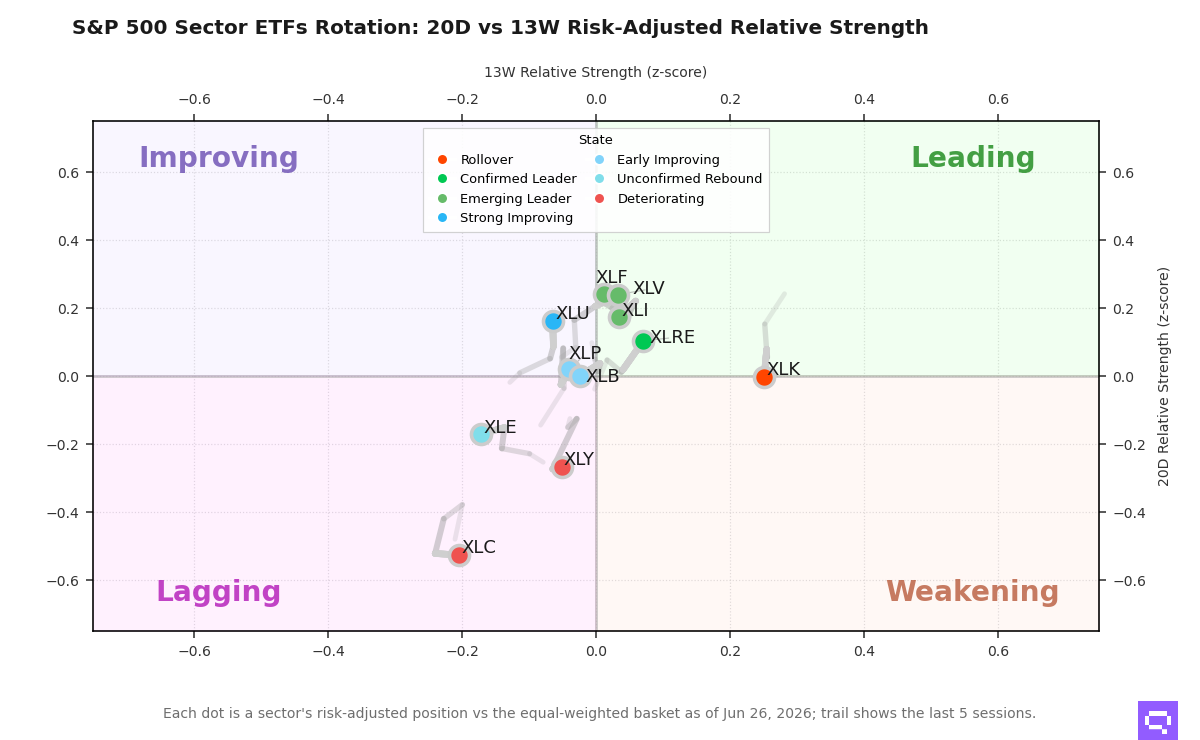
Health Care XLV ranks first this week at +1.11. It posted the strongest upside rotation into leadership, and its 20-day (tactical) line is +0.24 while the 13-week backing is +0.03. Real Estate XLRE ranks second at +0.53. It matched that advance and sits as the confirmed leader, with +0.10 on the 20-day line and +0.07 on the 13-week line. Utilities XLU ranks third at +0.52, Consumer Staples XLP ranks fourth at +0.26, and Energy XLE rebounded to -0.01 from a lagging base. The upside came through fresh leadership and recoveries, and the fastest movers rose from beneath the established tier.
Technology XLK posted the steepest downside rotation. It ranks tenth at -0.45, two places below its 20-day standing, even as the 13-week line sits at +0.25. Consumer Discretionary XLY and Communication Services XLC filled out the deteriorating cluster at -0.42 and -0.70. Financials XLF rose tactically and ranks seventh, six places below its 20-day standing. Seven of the eleven sectors hold positive leadership states, so selection now splits between fresh leaders near the top of the weekly table and growth-heavy names lower in it.
Sector Rotation Map
Romain Gandon
CEO, Quantlake
Disclaimer: This article is for informational and educational purposes only and does not constitute investment advice. Past performance is not indicative of future results.