.png)
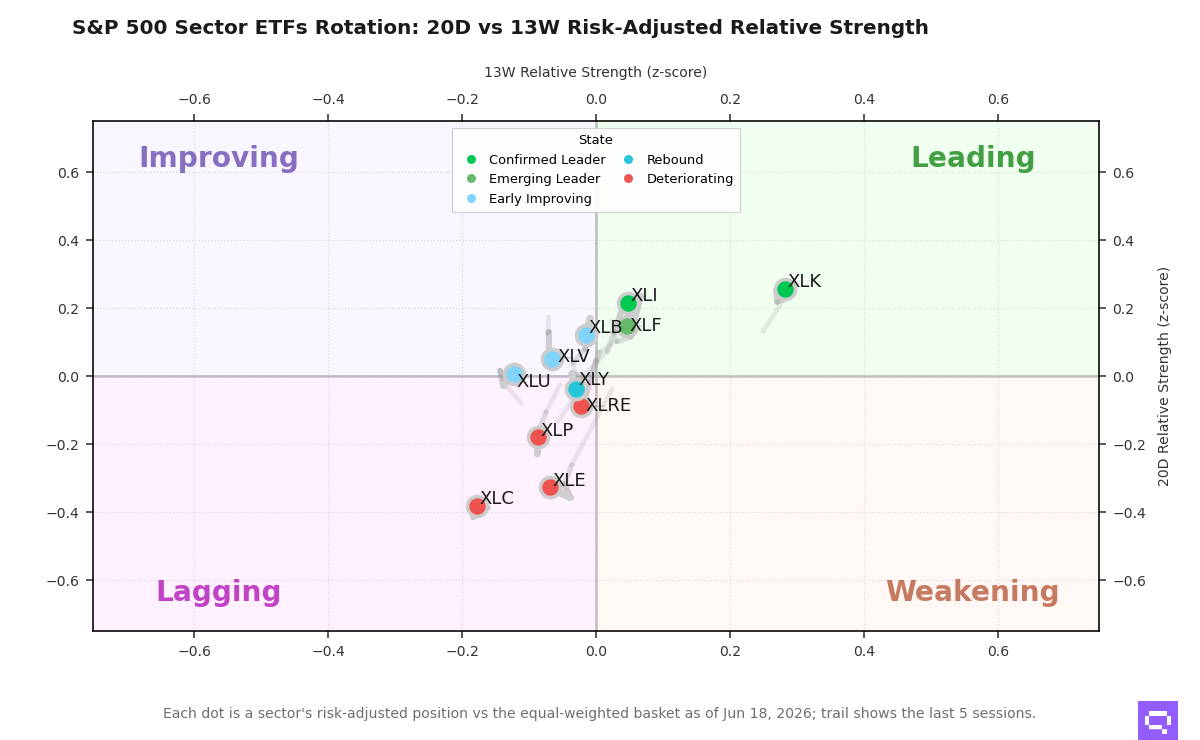
Sector Rotation: Industrials Lead as Energy Rolls Over
Energy leads the downside rotation while Industrial XLI tops the week inside the Leading quadrant.
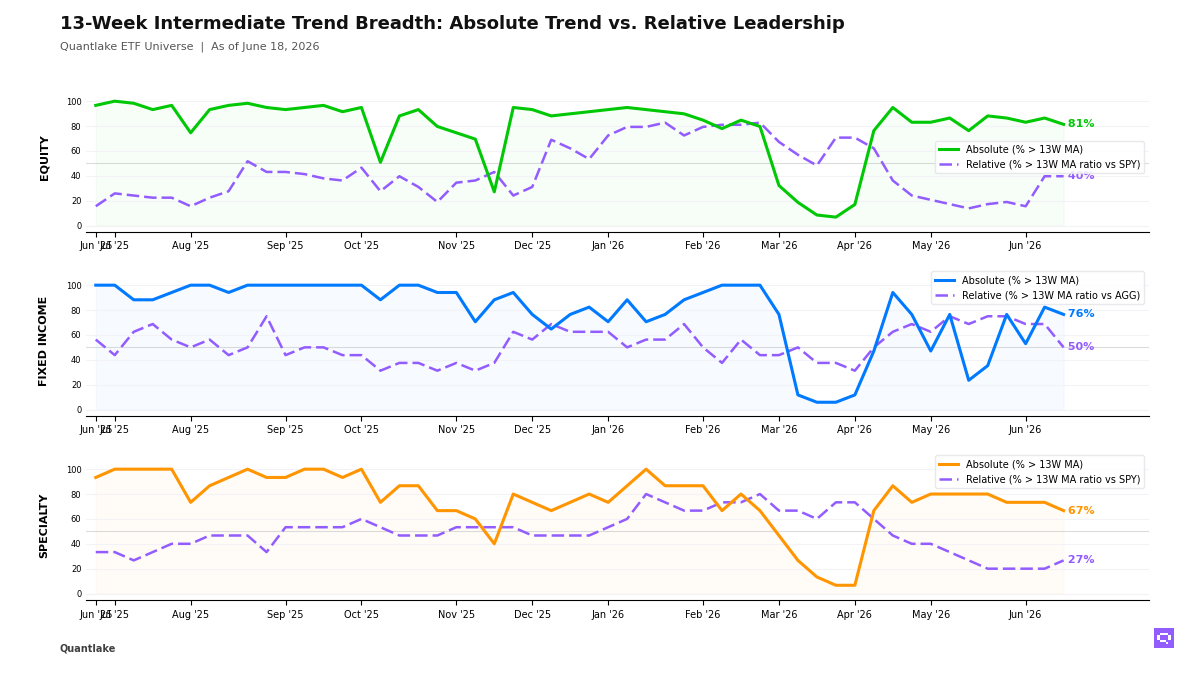
As of June 18, dispersion across the eleven S&P 500 sector ETFs sits in a normal regime: its z-score against the GARCH-normalised mean is +0.53, and the spread narrowed markedly over the past five sessions. The regime rewards selection through rotation rather than through an unusually wide spread.
Materials XLB posted the strongest upside rotation in the field, and Industrial XLI followed with another sharp advance. XLI tops the week at +0.53 in the Leading quadrant; Technology XLK sits third at +0.38 and anchors the 13-week (intermediate) line at +0.28. Financial XLF holds second at +0.44 as an emerging leader, positive on both horizons with near-zero intermediate backing. Consumer Discretionary XLY rebounded from a lagging base, and Utilities XLU strengthened from an improving base. The upside came from cyclical rotation and from recovery candidates rising beneath the established 13-week leader.
Energy XLE led the downside rotation and posted the steepest decline on the board. XLE sits last at -0.70 in the Lagging quadrant. Health Care XLV rolled over from an improving base and fell five ranks to tenth at -0.51. Consumer Staples XLP, Real Estate XLRE, and Communication Services XLC sit in deteriorating states. Six of eleven sectors hold positive leadership states, so leadership concentrates in cyclicals and recoveries, and defensives and energy occupy the weak half of the field.
Sector Rotation Map
Romain Gandon
CEO, Quantlake
Disclaimer: This article is for informational and educational purposes only and does not constitute investment advice. Past performance is not indicative of future results.