.png)
Sector Rotation: Health Care Leads a Rotation-Driven Tape
Communication Services XLC and Health Care XLV drove the week's strongest upside rotation from recovery and leadership positions.
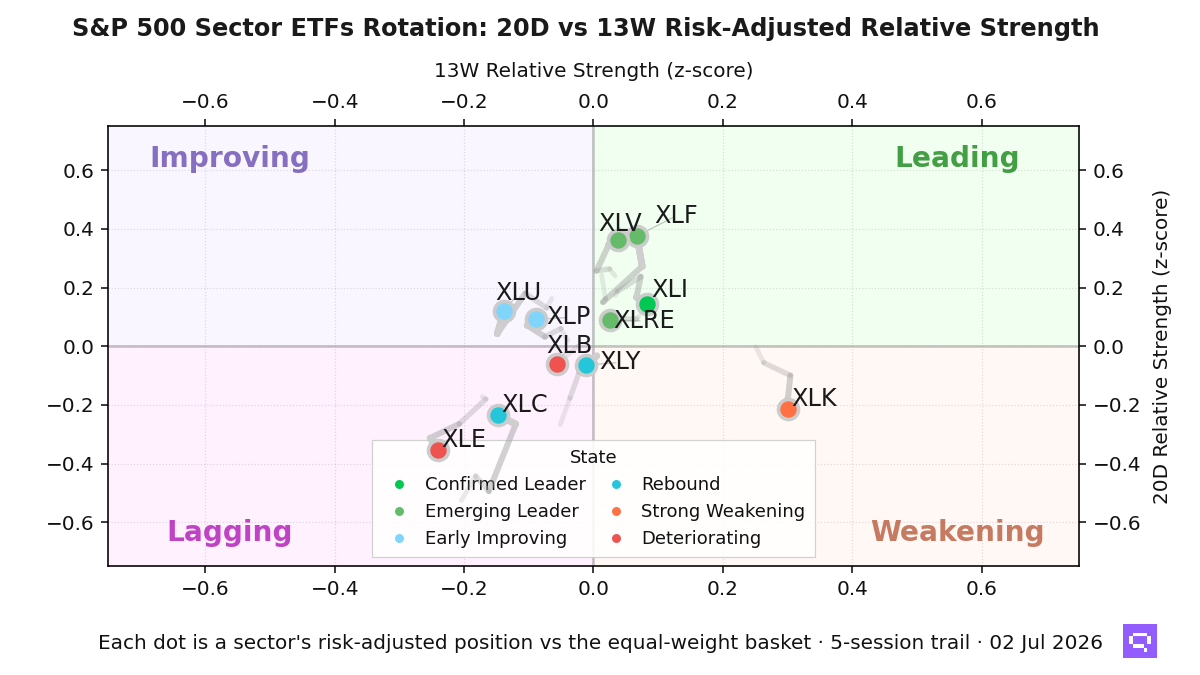
As of July 2, dispersion across the eleven S&P 500 sector ETFs sits in a normal regime: its z-score against the GARCH-normalised mean is +0.82, and the spread widened modestly over the past five sessions. The field spans all four quadrants, with four sectors in Leading, four in Lagging, two in Improving, and Technology XLK alone in Weakening. That spread across states makes the week rotation-driven, with cross-sectional moves more informative than a single-cluster beta regime.
Health Care XLV took the top weekly rank at +0.58, and Financials XLF followed at +0.55. The pair strengthened from leading positions over the week. Communication Services XLC produced the strongest upside rotation in the field and climbed seven ranks to third at +0.42; Consumer Discretionary XLY rebounded from a lagging base to fourth at +0.26. Industrials XLI holds the field's lone confirmed leadership state at +0.08 on the 13-week (intermediate) line, so the weekly lead sat with emerging leaders and recoveries.
Technology XLK posted the sharpest downside rotation and sat in Weakening at -0.23, a rollover warning against its +0.30 13-week lead. Energy XLE and Materials XLB filled the deteriorating cluster from lagging positions, with XLE last at -0.40 and XLB at -0.14 as both lost ground on both horizons. Industrials XLI rolled lower from its confirmed leadership state and fell five ranks to eighth. Four of the eleven sectors hold positive current-week readings, and the split between rebound strength in XLC and XLY and deterioration in XLK, XLE, and XLB makes sector selection more informative than broad beta exposure.
Sector Rotation Map
Romain Gandon
CEO, Quantlake
Disclaimer: This article is for informational and educational purposes only and does not constitute investment advice. Past performance is not indicative of future results.