.png)
Sector Rotation: Tech Leads as Dispersion Compresses
Low dispersion compresses the cross-section. Technology Select Sector SPDR® Fund leads; The Real Estate Select Sector SPDR Fund gains ground.
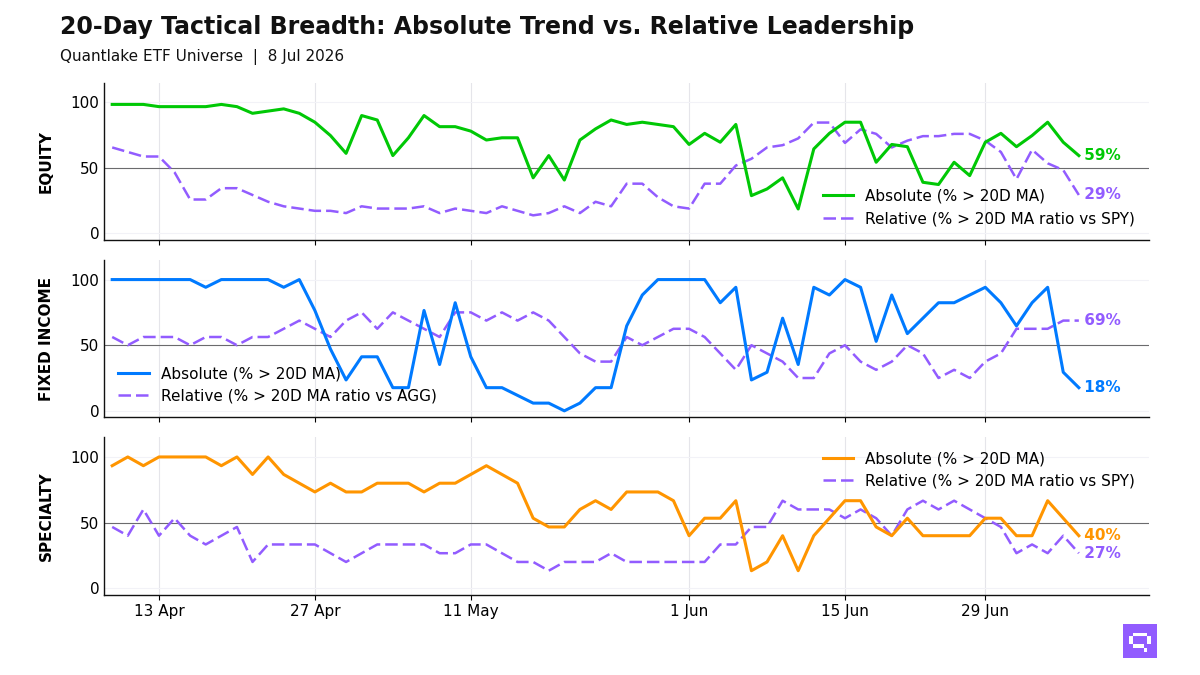
US equity sector dispersion across the 11 S&P 500 sector ETFs is compressed at -1.39 z, and negative velocity reinforces a low-dispersion, high-correlation tape. This beta-hugging regime narrows the cross-sectional spread and reduces selection breadth. Sector returns track the index more tightly.
Technology Select Sector SPDR® Fund is the confirmed leader. It leads the cross-section with positive 5-day relative strength, the strongest 20-day relative strength, and positive recent velocity. Health Care also sits in the leading quadrant. It pairs stronger 5-day relative strength with positive 20-day relative strength, but Technology holds the stronger structural position and Health Care fits better as a secondary leader.
Real Estate turns higher from a lagging base and stands out as the clearest early rotation candidate. Its 5-day relative strength crosses above zero against a near-flat 20-day profile. Utilities shows a similar pattern with weaker structural support. Energy rolls from above, losing 5-day momentum while holding positive 20-day relative strength. Communication Services and Materials sit below average on both horizons. Communication Services anchors the lagging side.
The configuration favors selective concentration in Technology. Improving rotations remain tactical rather than broadening leadership.
Sector Rotation Map
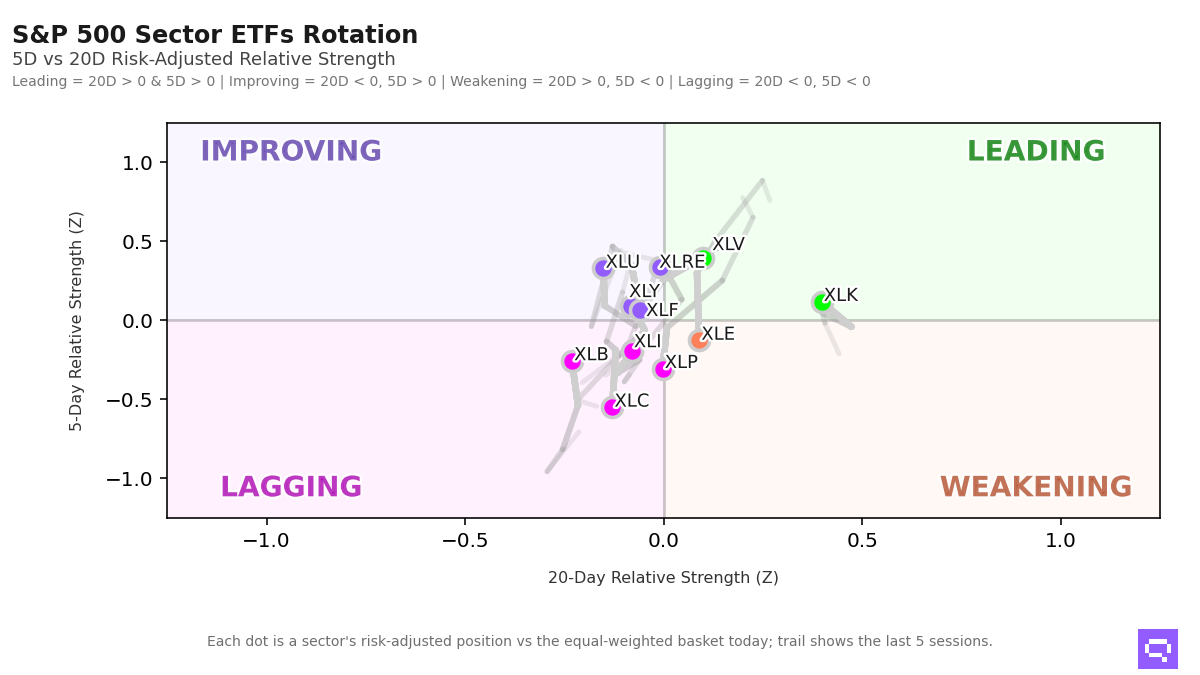
Alpha Z: risk-adjusted relative strength vs the equal-weighted S&P 500 sector basket (Z-score). Velocity: rate of change in short-term relative strength (1D vs 5D Z-score delta — tactical momentum). Structural velocity: smoothed 5D vs 20D momentum delta, reflecting regime-level directional shifts.
Momentum Leaders
• Technology — Rank #2 | Alpha Z: +0.35 | Velocity: +0.23
• Health Care — Rank #1 | Alpha Z: +0.77 | Velocity: +0.37
Rotation Warnings
• Consumer Staples — Rank shift (1D vs 5D): +1 | Structural velocity: -0.30
Mean Reversion Candidates
• Materials — Alpha Z: +0.04 | Velocity: +0.30
Romain Gandon
CEO, Quantlake
Disclaimer: This article is for informational and educational purposes only and does not constitute investment advice. Past performance is not indicative of future results.