.png)
Regime Trends: Equity Tape Turns Benchmark-Led
Price participation held as relative leadership broke lower
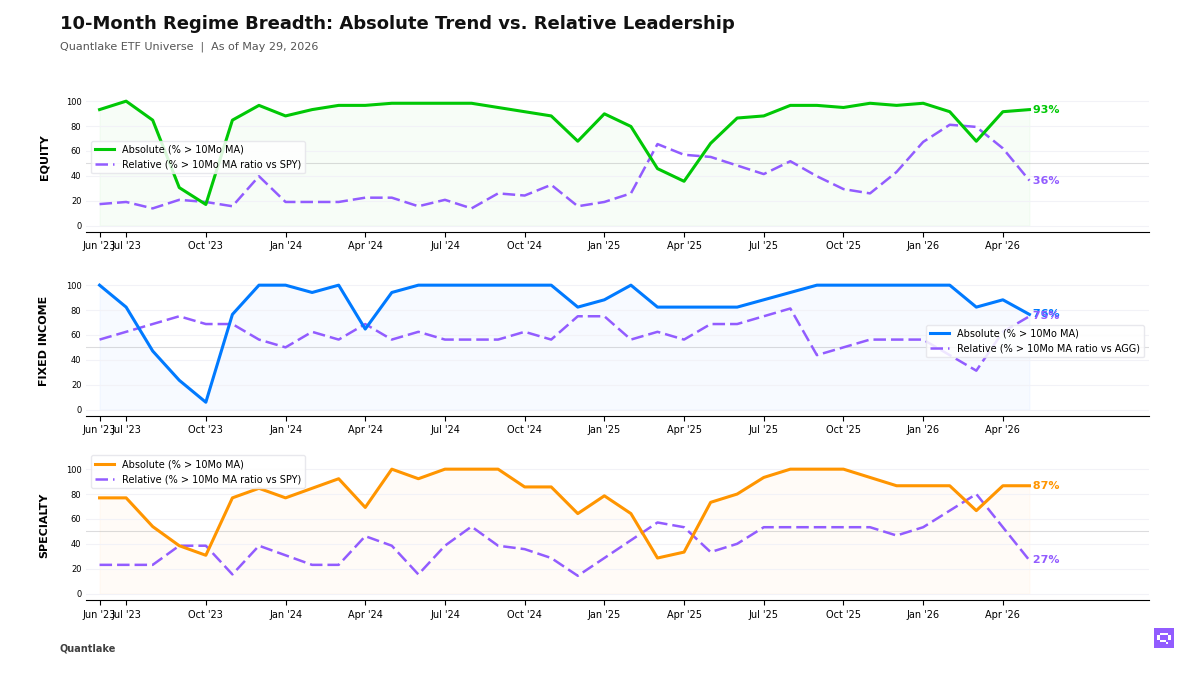
May closed with equity participation still high across our ETF universe, but leadership narrowed hard against the S&P 500 SPY. 55 of 59 ETFs (93%, +1.7pp) held above their 10-month moving average, yet only 21 of 58 ETFs (36%, -25.9pp) beat the S&P 500 SPY, leaving a +57pp gap. Relative leadership concentrated in Asia-Pacific, emerging markets, and select US growth and small-cap exposures, while low-volatility, dividend, and developed ex-US names held their price footing without keeping pace, which marks a benchmark-led equity regime rather than broad confirmation.
Fixed income rotated the other way. 13 of 17 ETFs (76%, -11.8pp) held above their 10-month moving average and 12 of 16 outperformed the Aggregate Bonds AGG (75%, +12.5pp), with credit, mortgage-backed, muni, and short-duration exposure leading as intermediate and long Treasuries lost ground. That leaves bonds in a broad-bull configuration, but the participation sits in spread sectors and stability sleeves rather than in duration.
Specialty showed the same narrowing. 13 of 15 ETFs (87%, unchanged on the month) stayed above their 10-month moving average, but only 4 of 15 outperformed the S&P 500 SPY (27%, -26.7pp), with Semiconductors SMH, momentum, and clean energy carrying the bucket as gold, managed futures, and real estate lost relative ground. In commodities, copper kept its price footing, Agriculture Basket DBA crossed below its 10-month ratio moving average versus SPY, and precious metals also gave back relative leadership, which extends the benchmark-led pattern beyond core equity.
10-Month Regime Breadth
Key Takeaways
• Emerging markets, Taiwan, South Korea, global cyclicals, and US growth and small-cap exposure still hold daily, weekly, and monthly relative alignment. Low-volatility, dividend, developed ex-US, and several defensive sectors still show the same multi-horizon lag. That alignment shows equity narrowing is established across timescales rather than isolated to the May close.
• Global Bonds BNDX crossed above its 10-month moving average and above its 10-month ratio moving average versus AGG. Investment Grade Credit LQD also crossed above its 10-month ratio moving average versus AGG, while 7-10yr Treasuries IEF, 3-7yr Treasuries IEI, and Int. Treasuries VGIT crossed below their 10-month moving averages. That split is clean inside fixed income, with spread sectors and non-US aggregate bonds strengthening as intermediate-duration Treasuries lose ground.
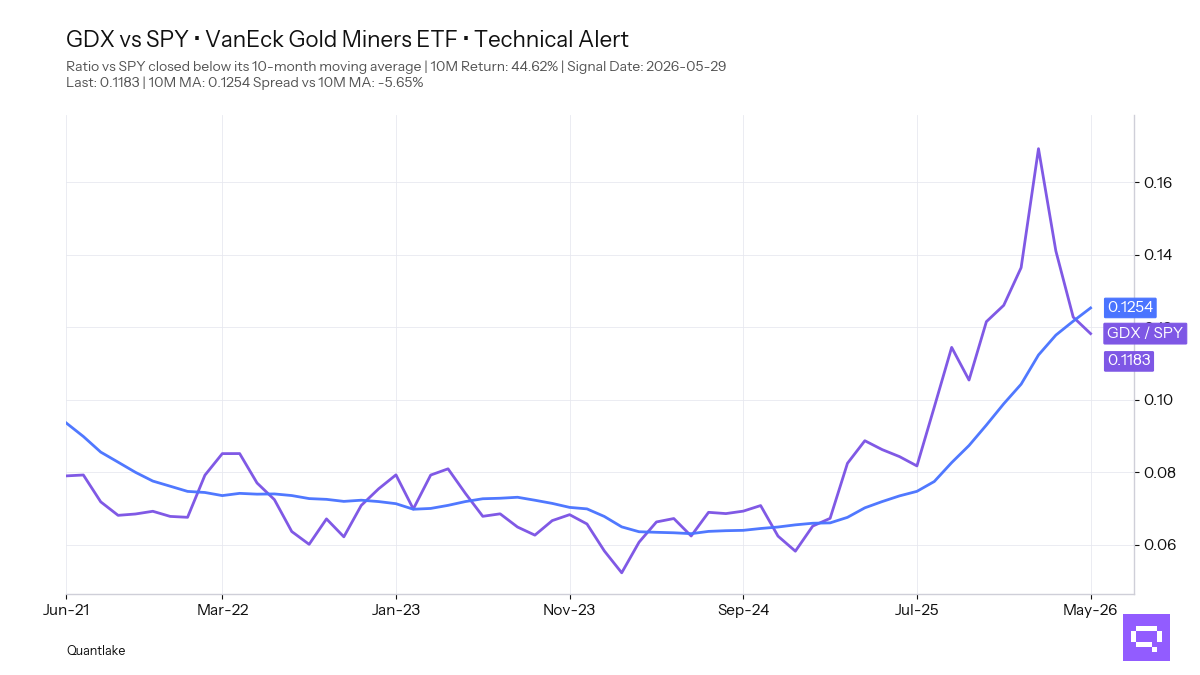
• Gold Miners GDX, with a +44.62% period relative return versus SPY, crossed below its 10-month ratio moving average. Gold GLD and Managed Futures DBMF also lost relative footing versus SPY, and Agriculture Basket DBA crossed below its 10-month ratio moving average versus SPY. That leaves hard-asset and alternative leadership fading even where price remains above its moving average.
FEATURED ETF — VanEck Gold Miners ETF GDX vs SPY
Other Technical Signal Events
EQUITY
↗ Price breakouts (cross-up 10M MA)
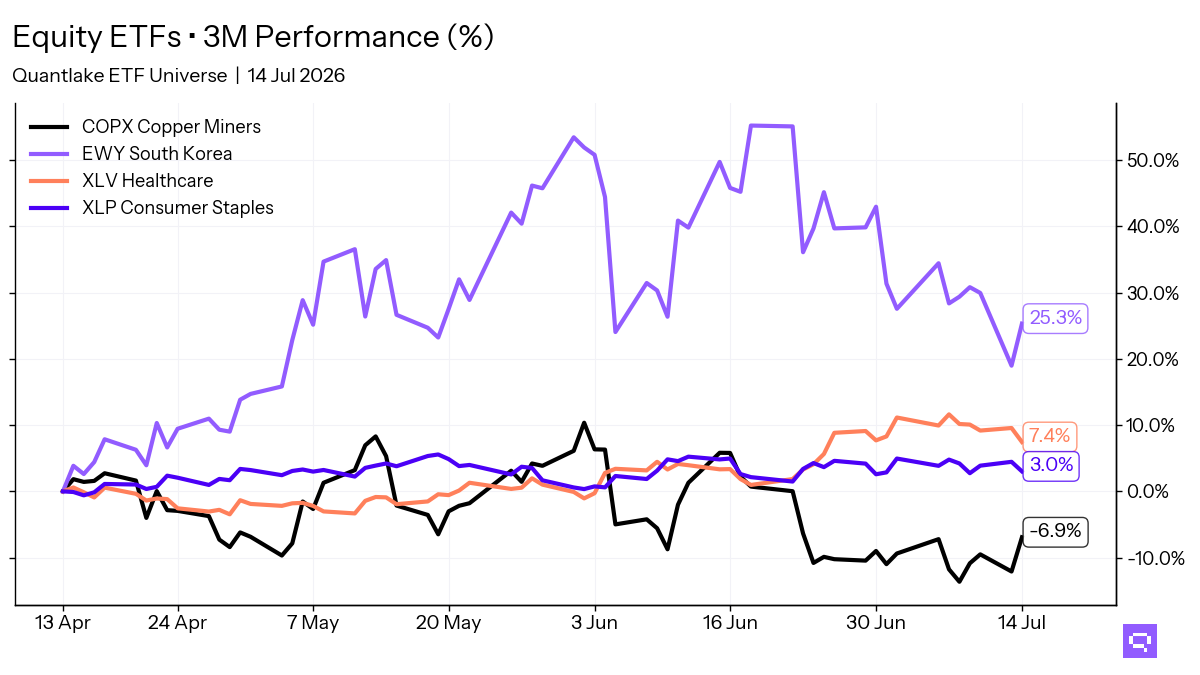
• XLV - Health Care Select Sector · 10M perf: +16.1%
↘ Price breakdowns (cross-down 10M MA)
None for the month
↗ Leadership gains (cross-up 10M MA vs SPY)
None for the month
↘ Leadership losses (cross-down 10M MA vs SPY)
• EWZ - iShares MSCI Brazil ETF · 10M relative perf: +16.0%
• VWO - Vanguard FTSE Emerging Markets · +2.1%
• VB - Vanguard Small-Cap · +1.7%
• IMTM - iShares MSCI Intl Momentum Factor ETF · +1.4%
• EFA - iShares MSCI EAFE ETF · +1.0%
• VYM - Vanguard High Dividend Yield · +0.2%
• VTI - Vanguard Total Stock Market · +0.2%
• URTH - iShares MSCI World ETF · unch.
• EWU - iShares MSCI United Kingdom ETF · -0.4%
• IQLT - iShares MSCI Intl Quality Factor ETF · -0.6%
• XLB - Materials Select Sector · -2.0%
• DVY - iShares Select Dividend ETF · -2.3%
• MDYV - SPDR® S&P 400 Mid Cap Value ETF · -4.2%
• XLI - Industrial Select Sector · -4.7%
• XLRE - SPDR Real Estate Select ETF · -9.7%
FIXED INCOME
↗ Price breakouts (cross-up 10M MA)
• BNDX - Vanguard Total International Bond · 10M perf: +1.9%
↘ Price breakdowns (cross-down 10M MA)
• IEF - iShares 7-10 Year Treasury Bond ETF · 10M perf: +3.0%
• VGIT - Vanguard Intermediate-Term Treasury · +2.7%
• IEI - iShares 3-7 Year Treasury Bond ETF · +2.5%
↗ Leadership gains (cross-up 10M MA vs AGG)
• BNDX - Vanguard Total International Bond · 10M relative perf: -1.8%
• LQD - iShares iBoxx $ Investment Grade Corporate Bond ETF · +0.3%
↘ Leadership losses (cross-down 10M MA vs AGG)
None for the month
SPECIALTY
↗ Price breakouts (cross-up 10M MA)
None for the month
↘ Price breakdowns (cross-down 10M MA)
None for the month
↗ Leadership gains (cross-up 10M MA vs SPY)
None for the month
↘ Leadership losses (cross-down 10M MA vs SPY)
• GDX - VanEck Gold Miners ETF · 10M relative perf: +44.6%
• GLD - SPDR® Gold · +14.1%
• DBMF - iMGP DBi Managed Futures Strategy ETF · +5.4%
• REET - iShares Global REIT ETF · -4.9%
COMMODITIES
↗ Price breakouts (cross-up 10M MA)
None for the month
↘ Price breakdowns (cross-down 10M MA)
None for the month
↗ Leadership gains (cross-up 10M MA vs SPY)
None for the month
↘ Leadership losses (cross-down 10M MA vs SPY)
• DBA - Invesco DB Agriculture · 10M relative perf: -9.7%
Romain Gandon
CEO, Quantlake
Disclaimer: This article is for informational and educational purposes only and does not constitute investment advice. Past performance is not indicative of future results.