.png)
Leadership Narrows at the Close
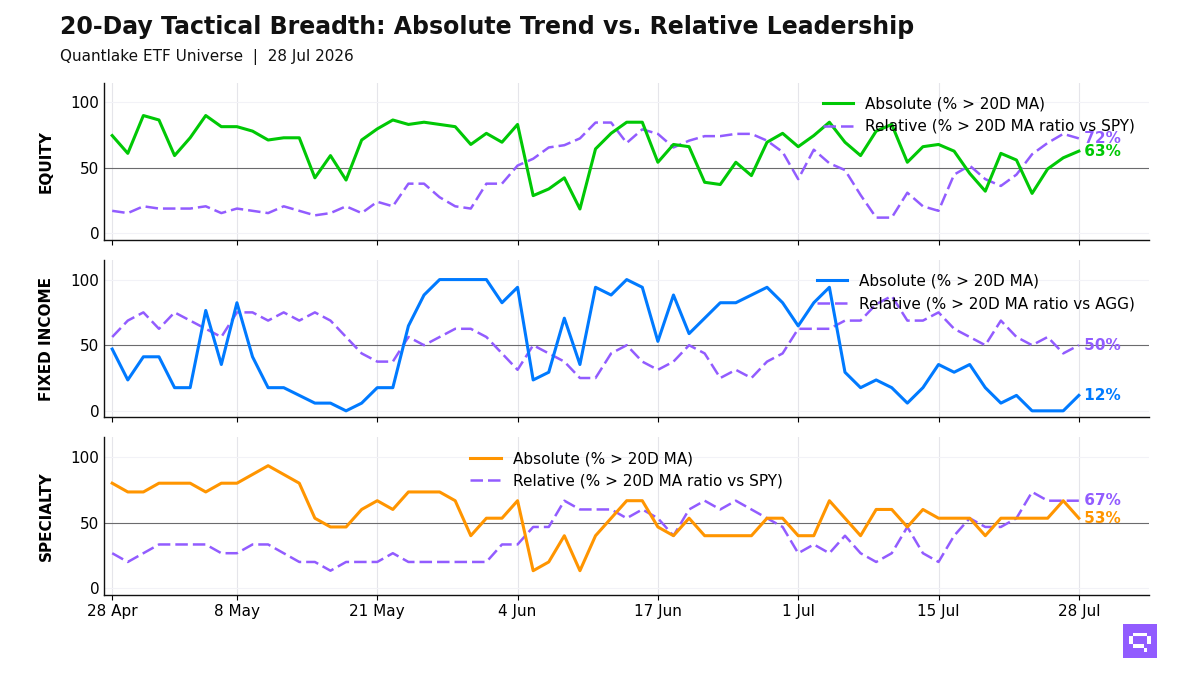
At the close, our ETF universe was holding more price support than genuine leadership, leaving participation visibly narrower across the board. In equity, 45 of 62 ETFs (73%, -8.1pp on the day) held above their 20-day moving average, but only 12 of 61 (20%, -3.3pp) outperformed their benchmark, a +53pp gap that keeps leadership with US growth, semis and parts of EM while US cyclicals, Germany and developed ex-US sit in recovery without relative strength. Fixed income weakened more abruptly on price, with 8 of 17 ETFs (47%, -29.4pp on the day) above their 20-day moving average versus 9 of 16 (56%, -6.2pp) on relative terms, leaving the surviving strength in high-yield credit, EM debt, munis, preferreds, inflation-linked bonds and short duration rather than in Treasuries or investment grade.
Alternatives are still benchmark-led rather than broad: 11 of 13 ETFs (85%, unchanged on the day) remained above their 20-day moving average, yet just 3 of 13 (23%, +7.7pp) outperformed SPY, a +62pp gap with leadership limited to bitcoin and energy-linked commodities while real estate and several commodity-linked recovery names lag. We are therefore looking at selective offensive leadership in technology and Asia, defensive resilience in parts of credit, and too many price-above-moving-average but benchmark-lagging names to treat this close as a fully confirmed broad advance.
20-Day Tactical Breadth

Key Takeaways
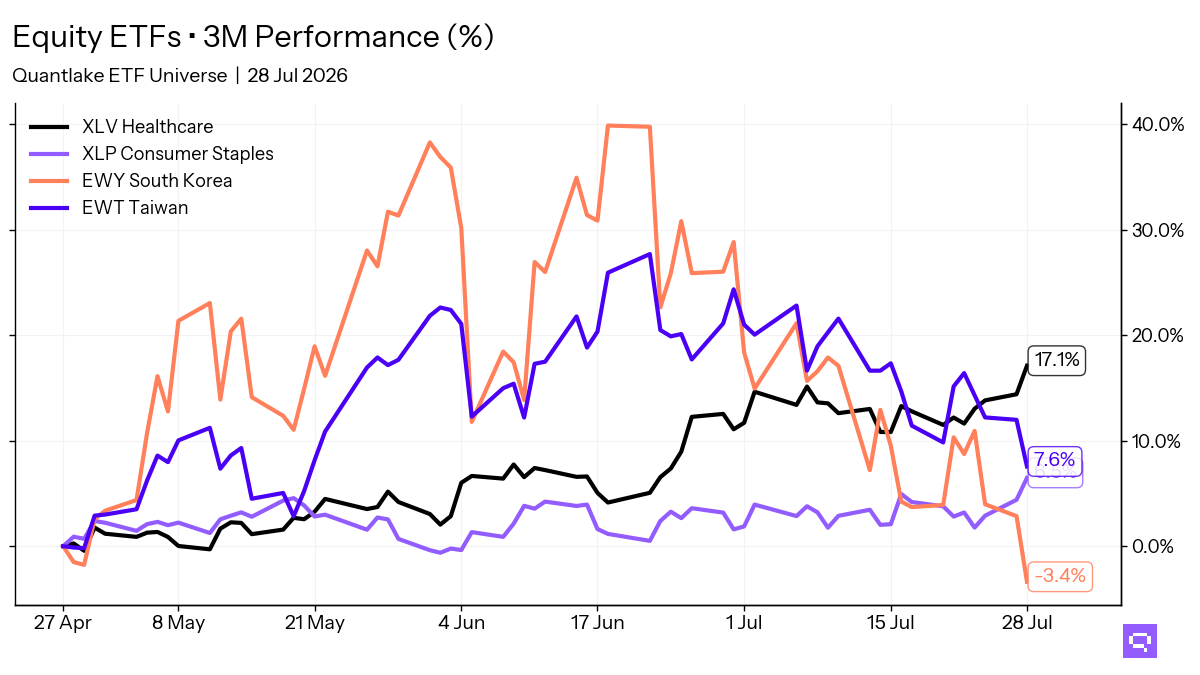
• Across daily, weekly and monthly windows, equity relative leadership still sits with emerging markets (EEM), Taiwan equity (EWT), South Korea equity (EWY), global equity (ICLN), US equity (IYW, QQQ, SPYG), momentum factor (MTUM), US/Global equity (SMH), value factor (VLUE) and Technology sector (XLK). By contrast, low-volatility factor, developed ex-US equity, China equity, Europe and several defensive US sectors remain the persistent relative laggards, which keeps the leadership map narrow even before we look at the latest daily deterioration.
• The bond message is a duration and quality split, not a uniform move across fixed income. EM Debt EMB, high-yield credit HYG and JNK, Muni Broad MUB, Preferred PFF, inflation-linked TIP and short-duration VCSH and VTIP retain relative sponsorship, while government/treasury exposure and long-duration paper continue to give ground; Mortgage-Backed MBB crossed below its 20-day moving average even as its ratio versus AGG crossed above, which is defensive relative strength without price confirmation.
• Commodity-linked equity beta is losing sponsorship even as some inflation-sensitive pockets try to stabilize. Copper Miners COPX crossed below its 20-day moving average after a +11.2% 20-day return and sits inside the equity laggard cluster alongside gold miners, while Energy XLE crossed above its 20-day moving average despite a -6.9% 20-day return and Broad Commodities PDBC crossed above its SPY ratio with a still-negative 20-day return, marking rebound and stabilization rather than established leadership.
FEATURED ETF — Global X Copper Miners ETF COPX

Other Technical Signal Events
EQUITY
Absolute Price Signals
Above 20D moving average
• Energy Select Sector XLE (20D perf: -6.86%)
• iShares MSCI USA Min Vol Factor ETF USMV (+2.28%)
Below 20D moving average
• Global X Copper Miners ETF COPX (20D perf: +11.22%)
• Vanguard FTSE Europe VGK (+7.88%)
• iShares MSCI Intl Quality Factor ETF IQLT (+7.72%)
• iShares MSCI Japan ETF EWJ (+7.41%)
• iShares MSCI EAFE ETF EFA (+7.32%)
• Materials Select Sector XLB (+4.71%)
• iShares China Large-Cap ETF FXI (+3.57%)
Relative Strength Signals (vs SPY)
Below 20D moving average
• iShares Russell 2000 ETF IWM (20D relative perf: +1.51%)
• Global X U.S. Infrastructure Development ETF PAVE (+0.60%)
FIXED INCOME
Absolute Price Signals
Below 20D moving average
• Vanguard Intermediate-Term Corporate Bond VCIT (20D perf: +1.31%)
• iShares MBS ETF MBB (+0.73%)
• Vanguard Intermediate-Term Treasury VGIT (+0.35%)
• iShares 3-7 Year Treasury Bond ETF IEI (+0.31%)
Relative Strength Signals (vs AGG)
Above 20D moving average
• iShares MBS ETF MBB (20D relative perf: unch.)
Below 20D moving average
• Vanguard Intermediate-Term Corporate Bond VCIT (20D relative perf: +0.60%)
• iShares 3-7 Year Treasury Bond ETF IEI (-0.39%)
ALTERNATIVES
Relative Strength Signals (vs SPY)
Above 20D moving average
• Invesco Optimum Yield Diversified Commodity Strategy No K-1 ETF PDBC (20D relative perf: -8.31%)
Romain Gandon
CEO, Quantlake
Disclaimer: This report is for informational and educational purposes only and does not constitute investment advice.