.png)

Intermediate Trends: Offshore Equities Reclaim Relative Leadership
The gap to SPY narrows as small caps and equal weight slip.
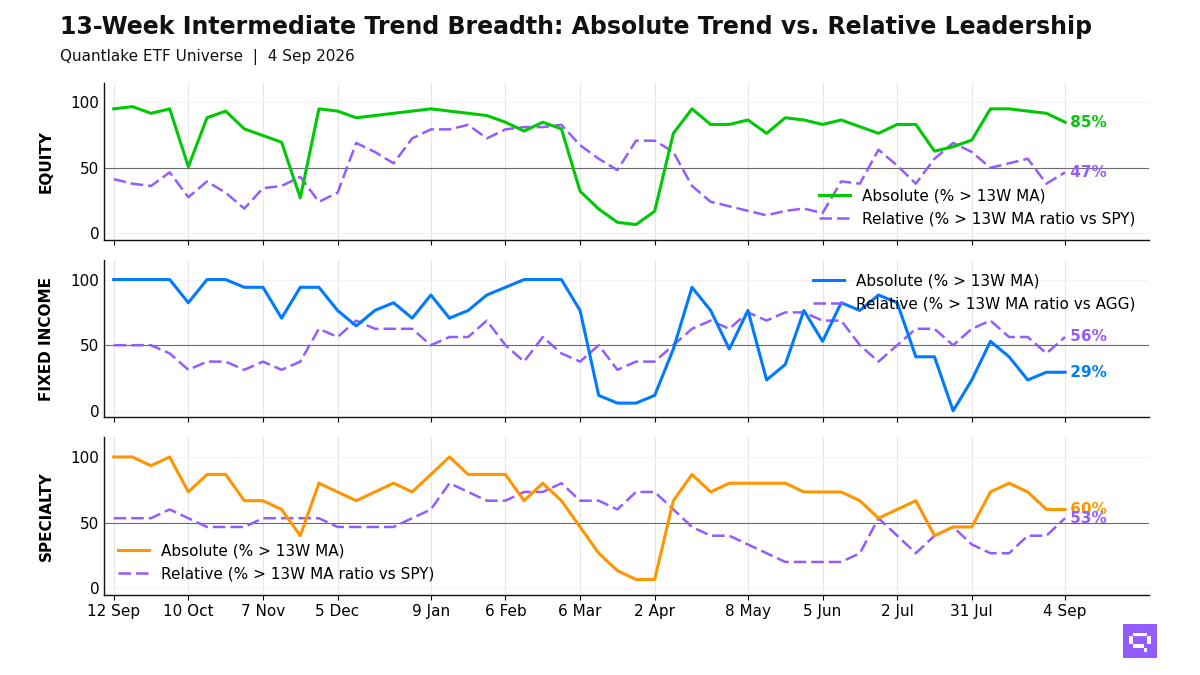
Offshore relative leadership defines the ETF universe on September 4, with 50 of 59 equity ETFs (85%, -6.8pp on the week) above their 13-week moving average (13W MA)s and 27 of 58 (47%, +8.6pp) above their ratio moving averages vs the S&P 500 SPY. Emerging markets, developed ex-US, and low-volatility ETFs lead the relative winners, while small caps, equal weight, and several U.S. sectors fill the laggard cluster. The price-relative gap narrowed to 38pp from 54pp. The configuration implies broad price participation with leadership concentrated away from SPY.
Credit and short duration define fixed income leadership, with 5 of 17 ETFs above their 13W MAs. High-yield credit, preferreds, and short-duration funds outperformed the Aggregate Bonds AGG, while Treasuries, investment grade, and long duration lagged. The bond profile concentrates strength in spread product and shorter duration. Rate-sensitive duration sits on the weak side.
Gold, bitcoin-linked exposures, and biotech lead specialty relative strength vs the S&P 500 SPY, while clean energy, real estate, and semiconductors fill the laggard cluster. Copper, oil, and broad commodities define the commodity signals. Hard-asset exposure defines the alternative pocket of our coverage.
13-Week Intermediate Breadth
Key Takeaways
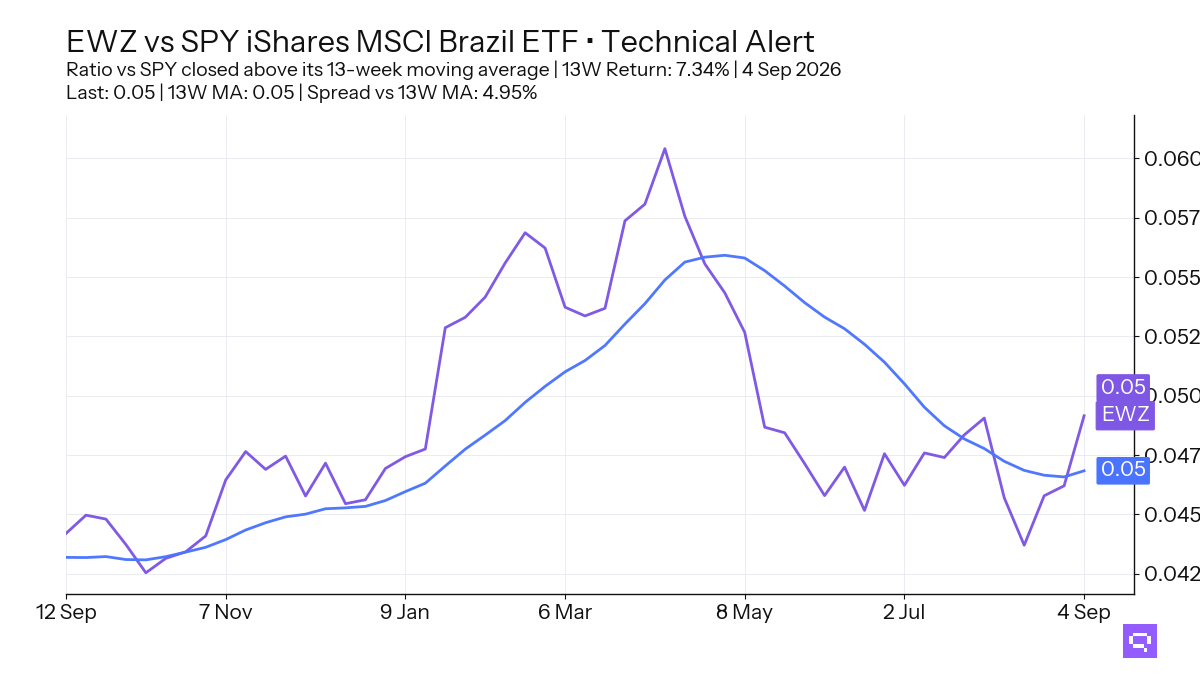
Brazil EWZ outperformed SPY by 7.34% over the trailing 13-week window and crossed above its 13-week ratio moving average (13W ratio MA). Japan EWJ and South Korea EWY also crossed above their ratio moving averages vs SPY, while Europe VGK crossed below. Non-U.S. leadership spans multiple regions, and the regional field is selective rather than uniform.
EM Sovereign Bonds EMB and TIPS TIP crossed above their ratio moving averages vs Aggregate Bonds AGG even though each trades below its price moving average. High yield and short duration anchor the leadership side, and Treasuries plus long duration anchor the laggards. Bond outperformance comes from spread product and duration defense rather than a core-bond price recovery.
Copper CPER crossed above its ratio moving average vs SPY, and commodity alignment reaches 80% across daily, weekly, and monthly windows. Long/Short Equity FTLS and Covered Calls Nasdaq JEPQ also crossed above their ratio moving averages vs benchmark. The specialty field pairs hard-asset leadership with selective equity-hedged stabilization.
FEATURED ETF: iShares MSCI Brazil ETF EWZ vs SPY
Other Technical Signal Events
Equity: Price vs 13-week MA
| Signal | Ticker | Name | 13W perf |
|---|---|---|---|
| Cross-down | IJR | iShares Core S&P Small-Cap ETF | +5.9% |
| Cross-down | IWM | iShares Russell 2000 ETF | +5.3% |
| Cross-down | XLP | Consumer Staples Select Sector | +2.1% |
| Cross-down | XLY | Consumer Discretionary Select Sector | +0.2% |
Equity vs SPY: Price Ratio vs 13-week MA
| Signal | Ticker | Name | 13W rel perf |
|---|---|---|---|
| Cross-up | SPYG | S&P 500 Growth ETF | -0.1% |
| Cross-up | IYW | iShares U.S. Technology ETF | +0.3% |
| Cross-up | VT | Vanguard Total World Stock Index ETF | +0.9% |
| Cross-up | VWO | Vanguard FTSE Emerging Markets Index ETF | +1.2% |
| Cross-up | IMTM | iShares MSCI Intl Momentum Factor ETF | +1.4% |
| Cross-up | EEM | iShares MSCI Emerging Markets ETF | +2.1% |
| Cross-up | VEA | Vanguard FTSE Developed Markets Index ETF | +2.4% |
| Cross-up | VLUE | iShares MSCI USA Value Factor ETF | +2.6% |
| Cross-up | EWY | iShares MSCI South Korea ETF | +3.0% |
| Cross-up | EWJ | iShares MSCI Japan ETF | +4.0% |
| Cross-up | EWZ | iShares MSCI Brazil ETF | +7.3% |
| Cross-down | VGK | Vanguard FTSE Europe Index ETF | +1.9% |
| Cross-down | RSP | Invesco S&P 500 Equal Weight ETF | +1.0% |
| Cross-down | SPYV | S&P 500 Value ETF | +0.3% |
| Cross-down | XLB | Materials Select Sector | -0.7% |
| Cross-down | MCHI | iShares MSCI China ETF | -3.0% |
| Cross-down | XLC | Communication Services Select Sector | -3.9% |
Fixed Income vs AGG: Price Ratio vs 13-week MA
| Signal | Ticker | Name | 13W rel perf |
|---|---|---|---|
| Cross-up | TIP | iShares TIPS Bond ETF | -0.2% |
| Cross-up | EMB | iShares J.P. Morgan USD Emerging Markets Bond ETF | +0.5% |
Specialty vs SPY: Price Ratio vs 13-week MA
| Signal | Ticker | Name | 13W rel perf |
|---|---|---|---|
| Cross-up | FTLS | First Trust Long/Short Equity ETF | -0.5% |
| Cross-up | JEPQ | JPMorgan Nasdaq Equity Premium Income ETF | +0.4% |
Commodities vs SPY: Price Ratio vs 13-week MA
| Signal | Ticker | Name | 13W rel perf |
|---|---|---|---|
| Cross-up | CPER | United States Copper LP | +0.2% |
Romain Gandon
CEO, Quantlake
Disclaimer: This article is for informational and educational purposes only and does not constitute investment advice. Past performance is not indicative of future results.