.png)

Intermediate Trends: Growth Leadership Separates From Dividend and Developed Markets
US growth and healthcare define the relative winners now
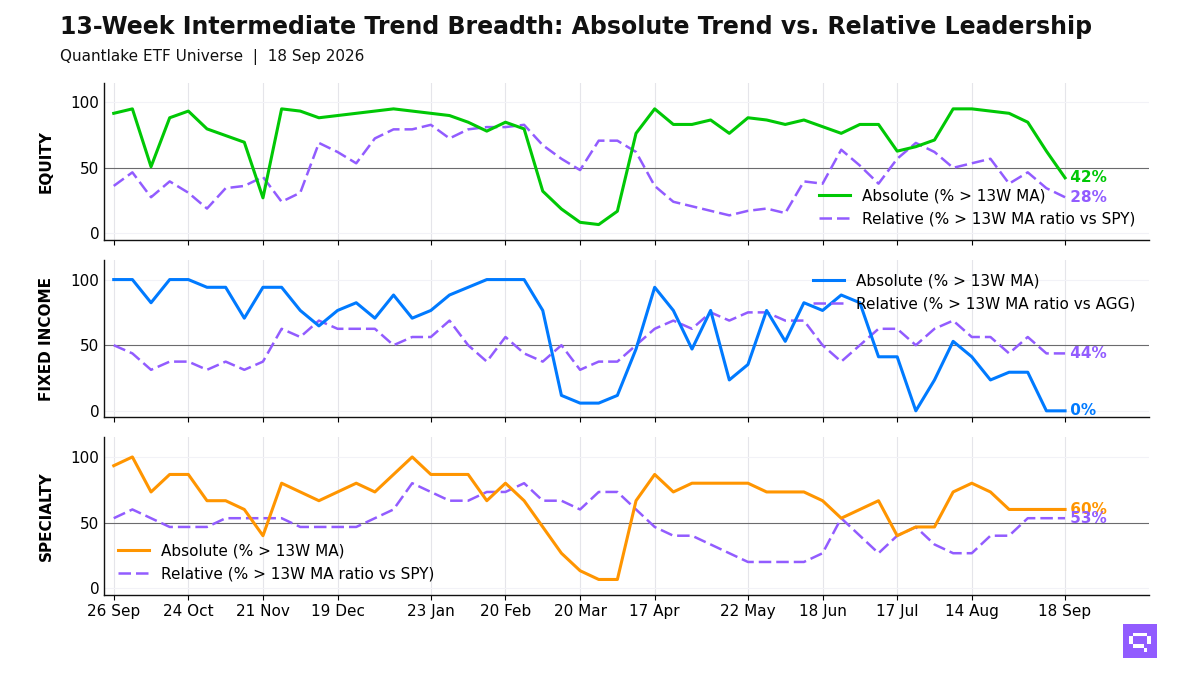
Growth leadership separates from the field as of September 18, with 25 of 59 ETFs (42%, -20.3pp on the week) holding above their 13-week MAs and only 16 of 58 ETFs (28%, -6.9pp) above their ratio MAs vs the S&P 500 SPY, concentrated in US growth, healthcare, technology, energy, and Asia-Pacific equity. Thirteen price cross-downs hit dividend, value, quality, China, and European exposures, with Select Dividend DVY and Dev. Markets EFA among the breaks. The 15pp price-relative gap narrowed from 29pp last week, so the equity setup is selective leadership with price damage outpacing benchmark-relative deterioration.
Fixed income shows no price sponsorship, with 0 of 17 ETFs above their 13-week MAs, and relative winners vs the Aggregate Bonds AGG are limited to high yield, EM debt, preferreds, short duration, and Global Bonds BNDX. 3-7yr Treasuries IEI crossed below its ratio MA, and the bond hierarchy is concentrated in credit and short duration, with 88% cross-timescale alignment separating those groups from Treasury rate sensitivity.
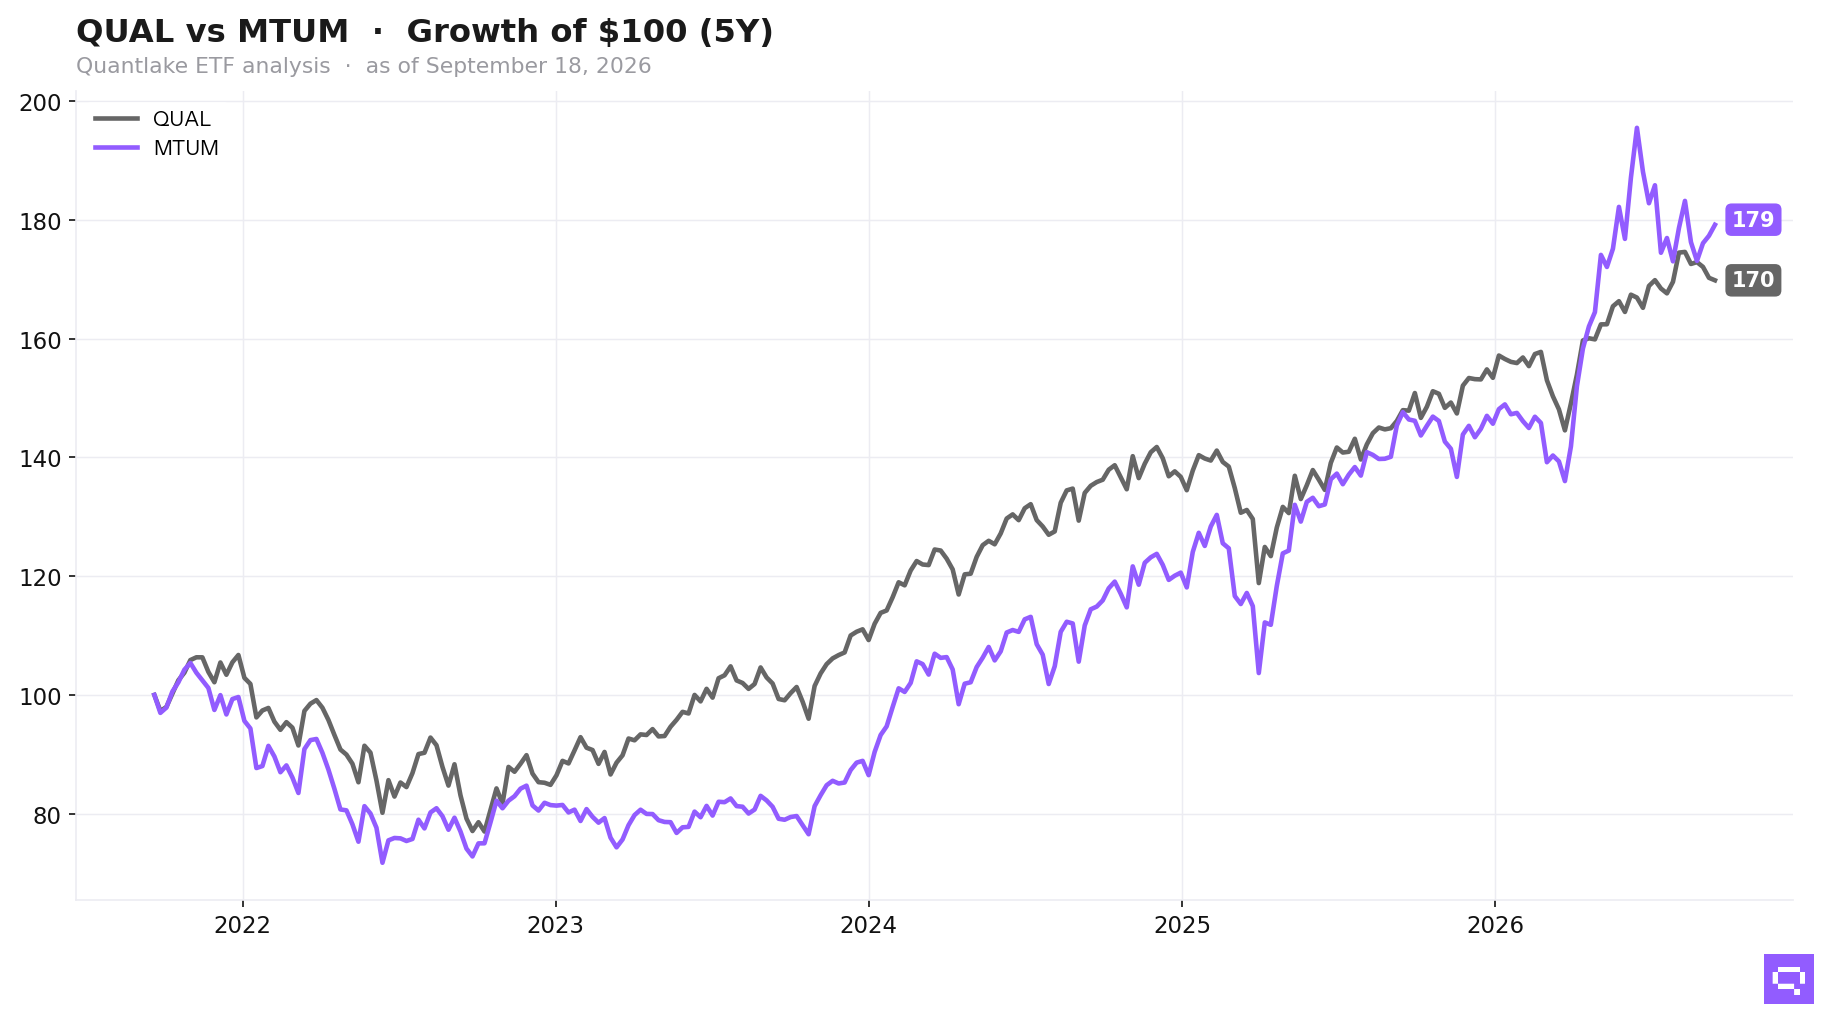
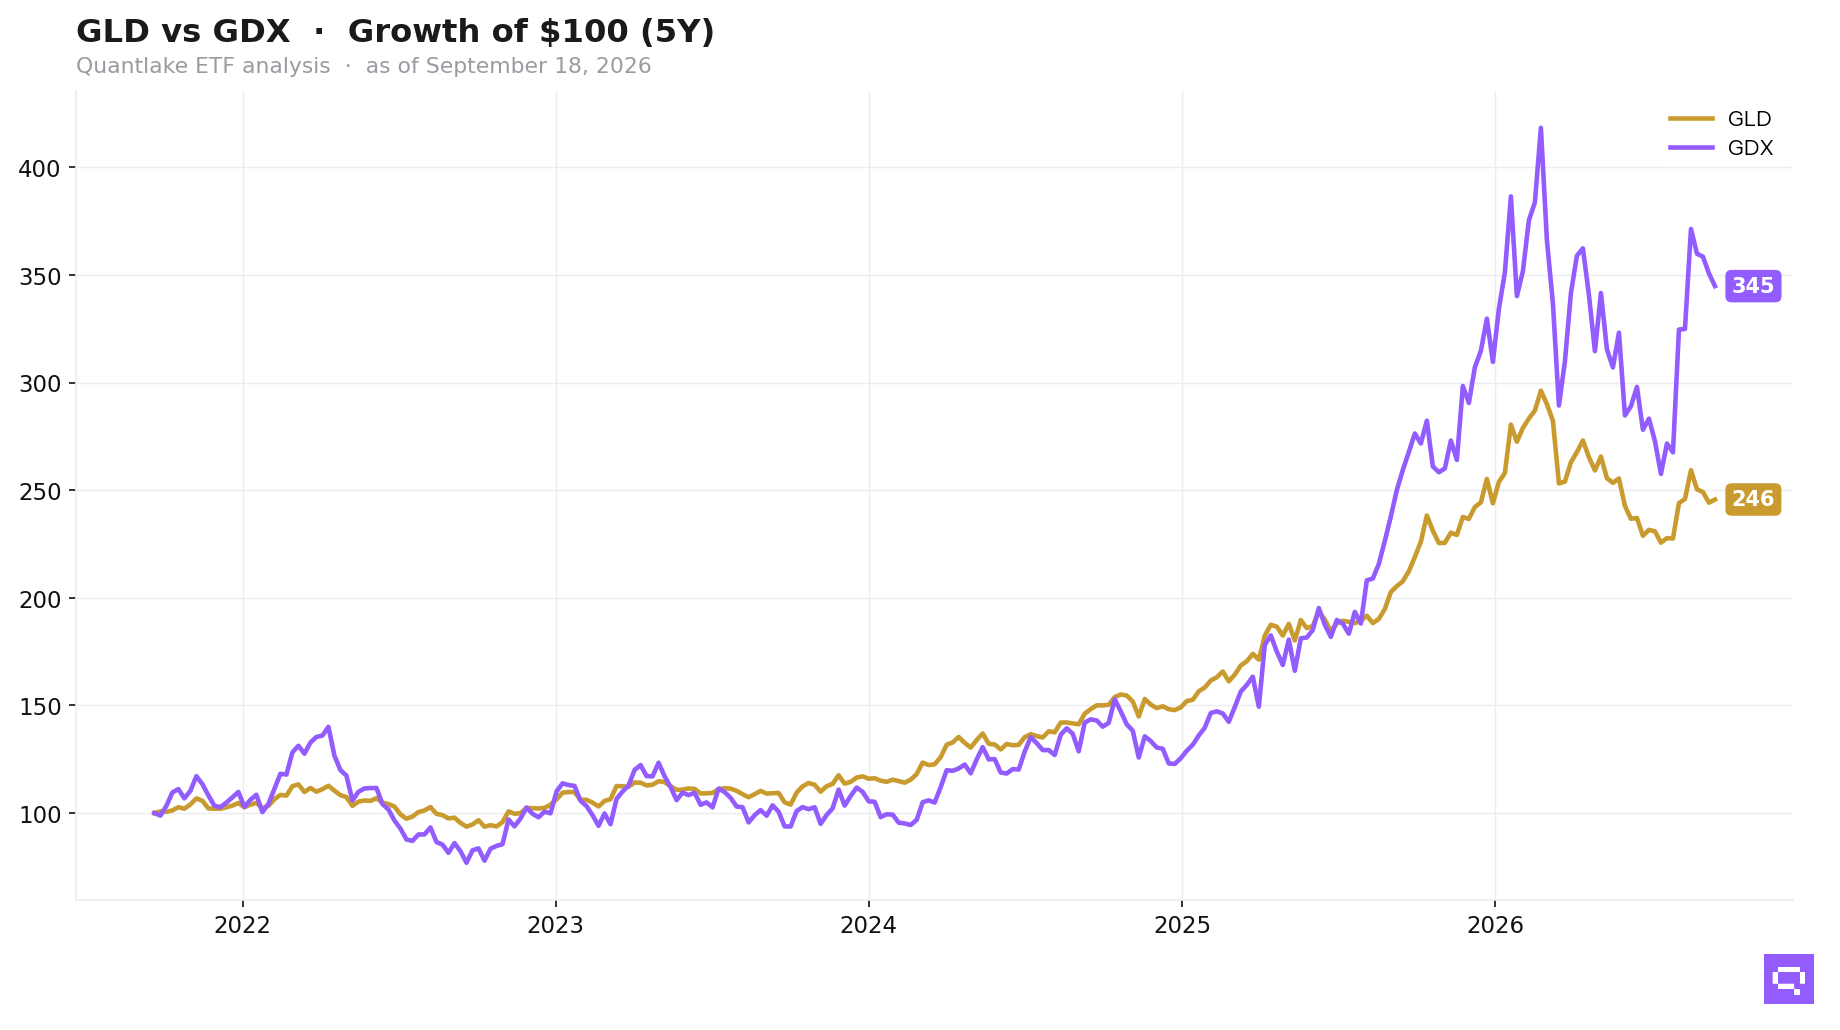
Specialty leadership vs the S&P 500 SPY is concentrated in crypto-linked funds, gold miners, bullion, and equity income, with 8 of 15 ETFs above their ratio MAs, and Momentum Factor MTUM crossed above its 13-week MA but occupies the price-above, benchmark-lagging bucket. Copper led commodities as Copper CPER crossed above its ratio MA vs the S&P 500 SPY and agriculture lagged, so specialty and commodity strength centers on hard assets and crypto.
13-Week Intermediate Breadth
Key Takeaways
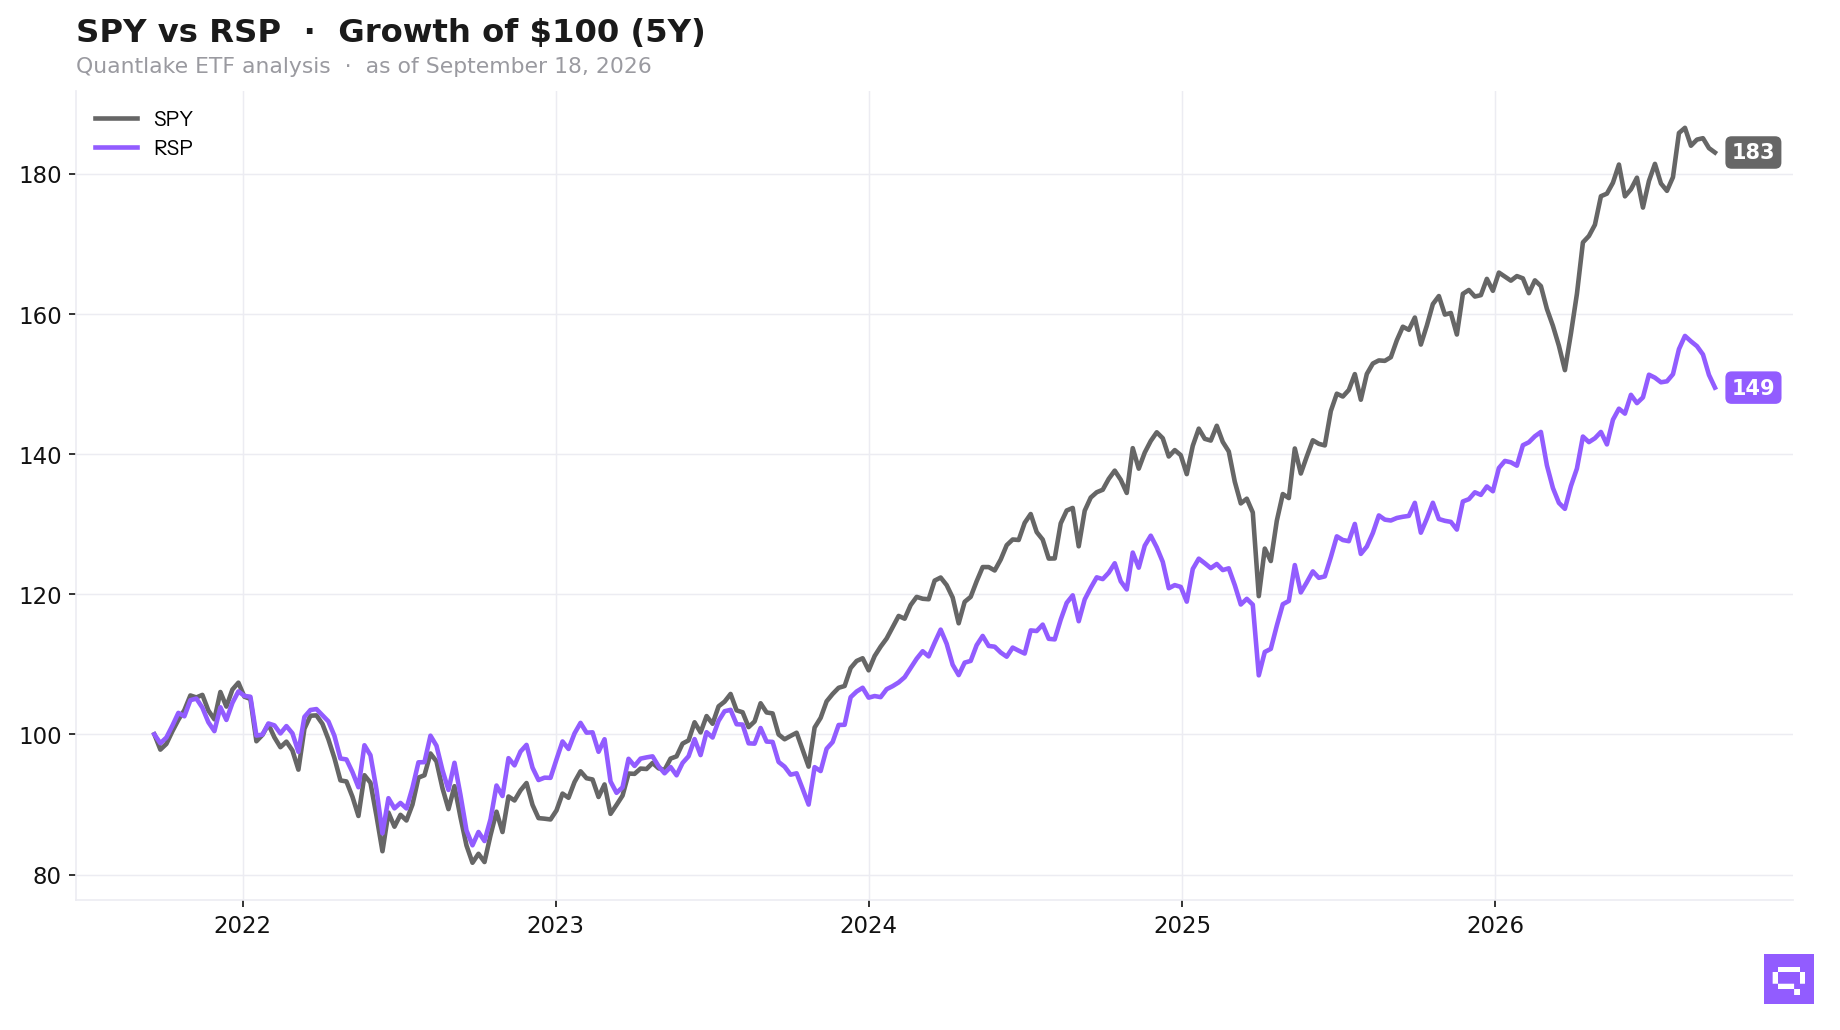
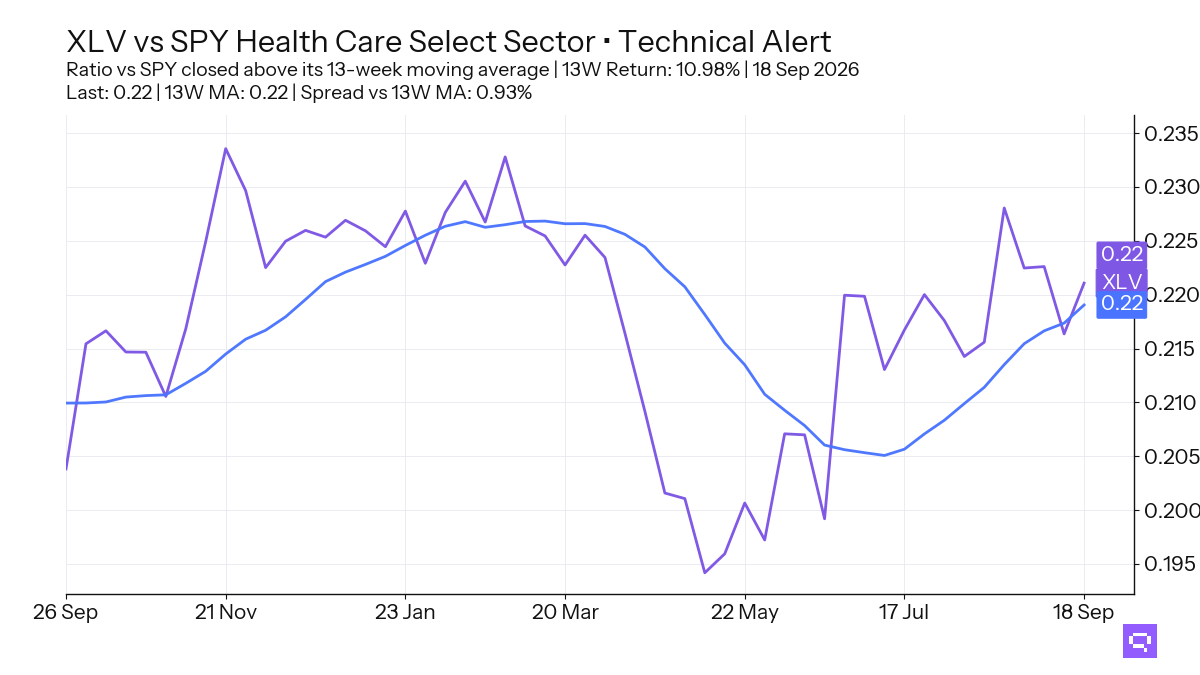
Healthcare XLV, up 10.98% relative to SPY over the trailing 13-week window, crossed above its 13-week ratio moving average (13W ratio MA). Russell Growth IWF and Nasdaq 100 QQQ also crossed above their ratio MAs vs the S&P 500 SPY, yet cross-timescale alignment in equity is only 32%. Healthcare and large-cap growth lead a narrow aligned cluster.
EM Sovereign Bonds EMB crossed above its ratio MA vs the Aggregate Bonds AGG, and Global Bonds BNDX joined the same relative winner cluster as 3-7yr Treasuries IEI crossed below. Credit and international duration outrank Treasury rate sensitivity, and 88% cross-timescale alignment gives that split internal agreement.
Momentum Factor MTUM crossed above its 13-week MA after an 8.35% 13-week return, yet its ratio sits below its ratio MA vs the S&P 500 SPY. Min Volatility USMV crossed below its 13-week MA, and Copper CPER crossed above its ratio MA vs the S&P 500 SPY. Specialty price recovery lacks broad benchmark confirmation, and commodity leadership is selective.
FEATURED ETF: Health Care Select Sector XLV vs SPY
Other Technical Signal Events
Equity: Price vs 13-week MA
| Signal | Ticker | Name | 13W perf |
|---|---|---|---|
| Cross-down | XLF | Financial Select Sector | +4.6% |
| Cross-down | DVY | iShares Select Dividend ETF | +4.1% |
| Cross-down | EWU | iShares MSCI United Kingdom ETF | +4.0% |
| Cross-down | FXI | iShares China Large-Cap ETF | +3.1% |
| Cross-down | SPYV | S&P 500 Value ETF | +2.9% |
| Cross-down | JEPI | JPMorgan Equity Premium Income ETF | +2.3% |
| Cross-down | IQLT | iShares MSCI Intl Quality Factor ETF | +1.5% |
| Cross-down | EWG | iShares MSCI Germany ETF | +1.5% |
| Cross-down | VYM | Vanguard High Dividend Yield Index ETF | +0.7% |
| Cross-down | EFA | iShares MSCI EAFE ETF | +0.5% |
| Cross-down | VEA | Vanguard FTSE Developed Markets Index ETF | -1.3% |
| Cross-down | IMTM | iShares MSCI Intl Momentum Factor ETF | -1.4% |
Equity vs SPY: Price Ratio vs 13-week MA
| Signal | Ticker | Name | 13W rel perf |
|---|---|---|---|
| Cross-up | QQQ | Invesco QQQ | -4.4% |
| Cross-up | IWF | iShares Russell 1000 Growth ETF | -1.8% |
| Cross-up | XLV | Health Care Select Sector | +11.0% |
| Cross-down | SCHD | Schwab U.S. Dividend Equity ETF | +4.5% |
| Cross-down | ACWV | iShares MSCI Global Min Vol Factor ETF | +2.7% |
| Cross-down | XLF | Financial Select Sector | +2.6% |
| Cross-down | IVLU | iShares Edge MSCI Intl Value Factor ETF | +1.6% |
| Cross-down | XLC | Communication Services Select Sector | -0.5% |
| Cross-down | VEA | Vanguard FTSE Developed Markets Index ETF | -3.2% |
| Cross-down | IMTM | iShares MSCI Intl Momentum Factor ETF | -3.3% |
Fixed Income vs AGG: Price Ratio vs 13-week MA
| Signal | Ticker | Name | 13W rel perf |
|---|---|---|---|
| Cross-up | EMB | iShares J.P. Morgan USD Emerging Markets Bond ETF | -0.2% |
| Cross-up | BNDX | Vanguard Total International Bond Index ETF | unch. |
| Cross-down | IEI | iShares 3-7 Year Treasury Bond ETF | +0.4% |
| Cross-down | TIP | iShares TIPS Bond ETF | -0.1% |
Specialty: Price vs 13-week MA
| Signal | Ticker | Name | 13W perf |
|---|---|---|---|
| Cross-up | MTUM | iShares MSCI USA Momentum Factor ETF | -8.4% |
| Cross-down | USMV | iShares MSCI USA Min Vol Factor ETF | +4.7% |
Commodities vs SPY: Price Ratio vs 13-week MA
| Signal | Ticker | Name | 13W rel perf |
|---|---|---|---|
| Cross-up | CPER | United States Copper LP | +1.5% |
| Cross-down | DBA | Invesco DB Agriculture | +3.6% |
Romain Gandon
CEO, Quantlake
Disclaimer: This article is for informational and educational purposes only and does not constitute investment advice. Past performance is not indicative of future results.