.png)
Intermediate Trends: Equity Leadership Rotates Beyond Growth
Relative participation widened even as price breadth slipped
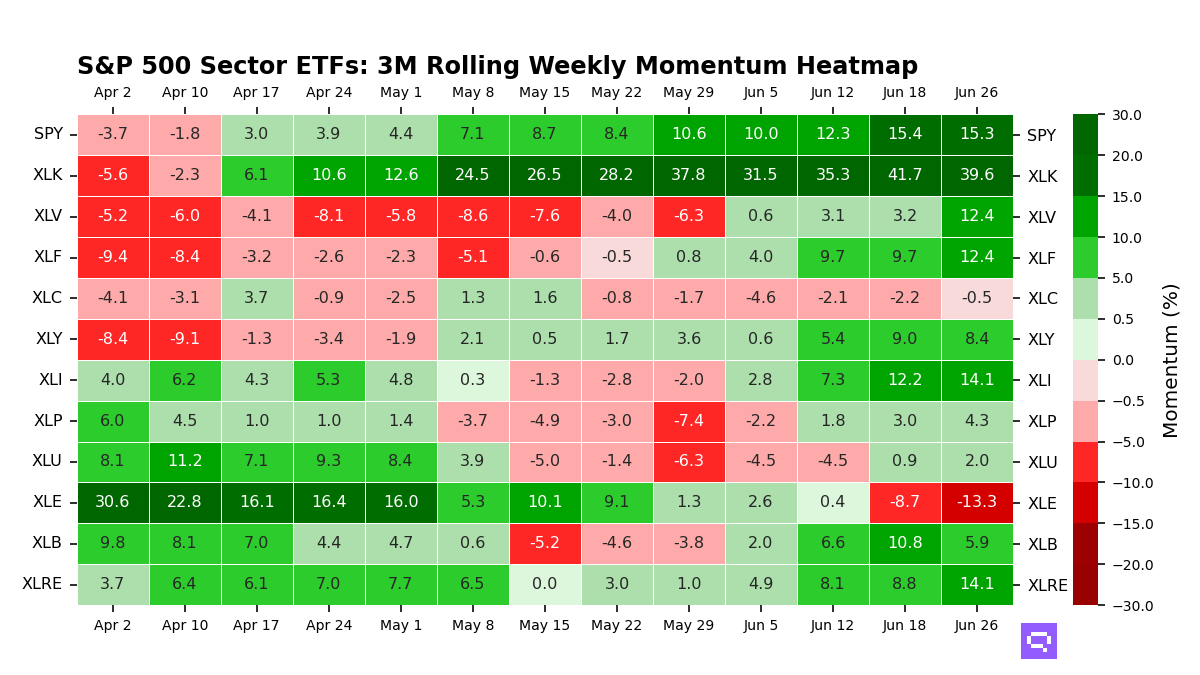
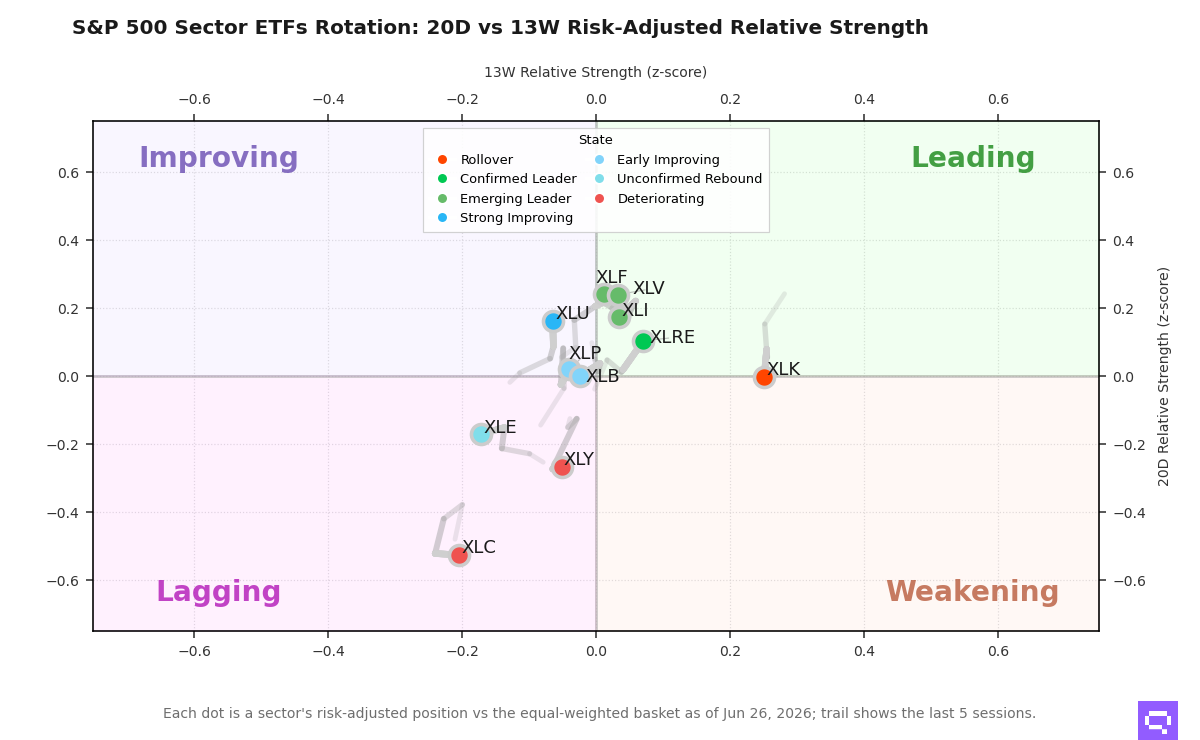
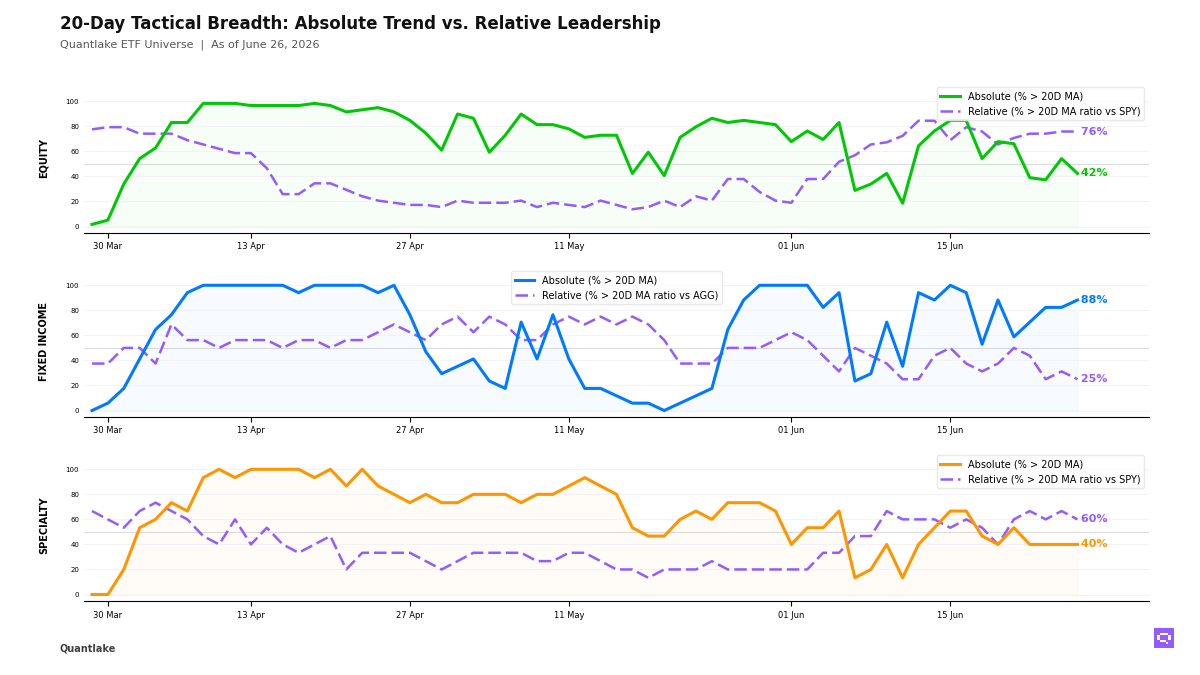
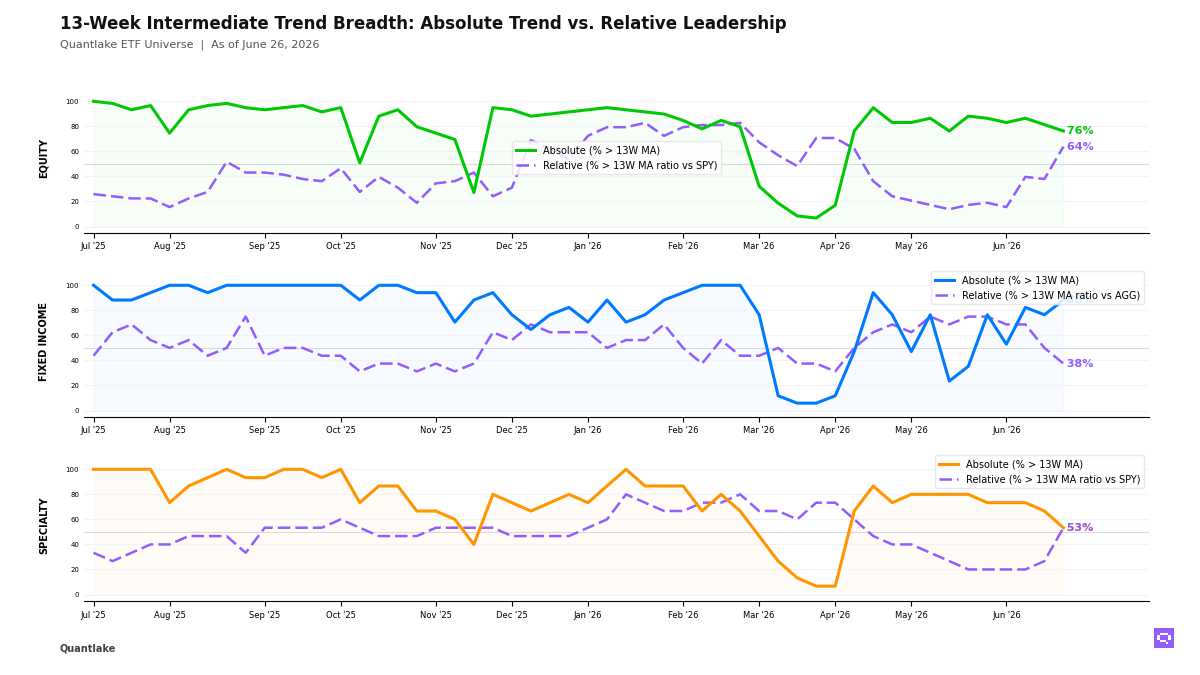
As of June 26, 45 of 59 equity ETFs (76%, -5.1pp on the week just closed) held above their 13-week moving average (13W MA), and 37 of 58 (64%, +25.9pp) held above their 13-week ratio moving average vs S&P 500 SPY (13W ratio MA vs SPY). Dividend, value, small-cap, and defensive exposures drove the relative rebound. Consumer Staples XLP and Utilities XLU crossed above their 13W MAs. Growth, consumer discretionary, China, and copper miners crossed below theirs. The equity tape sits in a broad-bull regime, and the leadership set is wider than the prior week's growth concentration.
Fixed income recovered in price, with intermediate Treasuries and TIPS crossing above their 13W MAs. Only 6 of 16 funds held above their 13W ratio MA vs the Aggregate Bonds AGG. Long duration and investment grade led the relative winners. High yield and preferred lagged. The bond move is benchmark-led, with a 51pp price-relative gap that points to rate sensitivity rather than credit beta.
Biotechnology, real estate, semiconductors, and min-vol vs the S&P 500 SPY led specialty leadership, while managed futures, clean energy, gold proxies, and bitcoin proxies sat below their 13W MAs. Copper CPER crossed below its 13W MA. Silver sat among the cross-timescale laggards. The specialty and commodity mix is selective, with equity-linked specialty winners offset by weaker metal and alternative exposure.
13-Week Intermediate Breadth
Key Takeaways
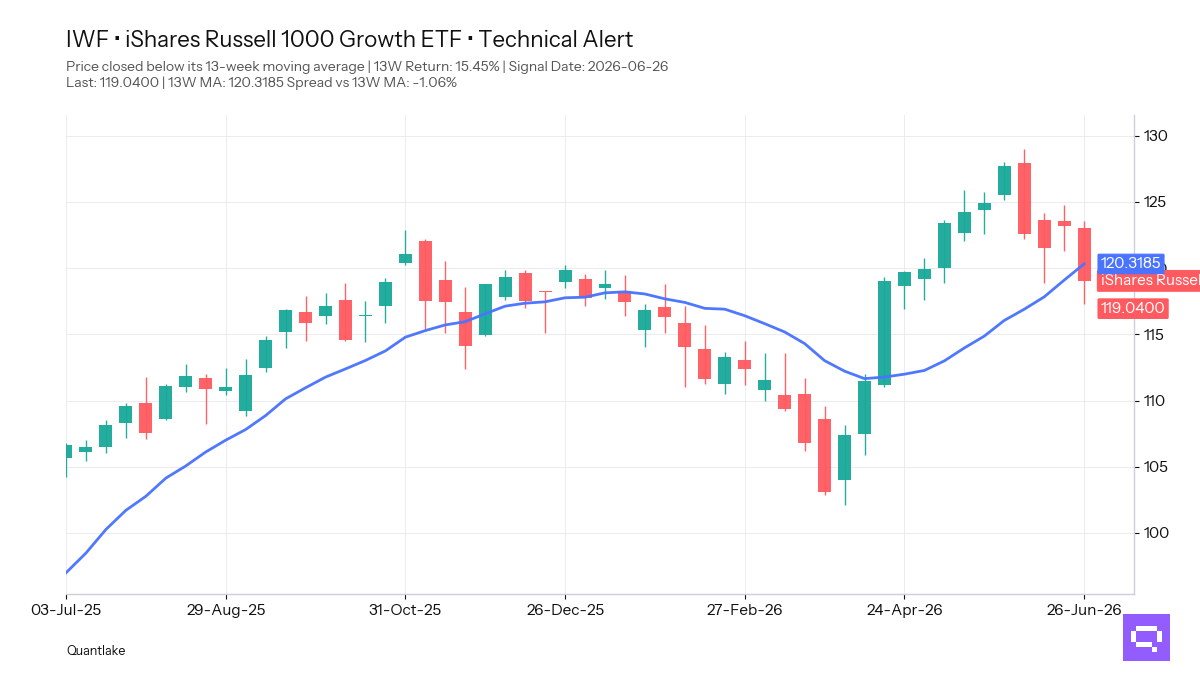
Growth IWF, up 15.45% over the period, crossed below its 13-week moving average. S&P Growth SPYG, up 5.10% versus S&P 500 SPY over the period, crossed below its 13W ratio MA versus SPY, while High Dividend DVY and S&P Value SPYV crossed above theirs. The leadership handoff favors dividend and value repair over growth concentration.
3-7yr Treasuries IEI and Int. Treasuries VGIT crossed above their 13W MAs, and Corporate Credit VCIT crossed above its 13W ratio MA versus the Aggregate Bonds AGG. High Yield HYG and Preferred Stock PFF crossed below their 13W ratio MAs versus AGG, and cross-timescale alignment reached 94% across fixed income. The bond leadership profile is duration- and investment-grade-heavy.
Min Volatility USMV crossed above its 13W MA and its 13W ratio MA versus S&P 500 SPY in the same week, and Biotechnology IBB, Global REITs REET, and Real Estate VNQ crossed above their 13W ratio MAs versus SPY. Managed Futures DBMF and Clean Energy ICLN crossed below their 13W MAs, and Copper CPER did the same in commodities. Specialty leadership clusters in rate-sensitive equity surrogates, while metals and alternative diversifiers lost ground.
FEATURED ETF: iShares Russell 1000 Growth ETF IWF
Other Technical Signal Events
EQUITY
↗ Price breakouts (cross-up 13W MA)
XLU - Utilities Select Sector · 13W perf: +2.0%
XLP - Consumer Staples Select Sector · +4.3%
↘ Price breakdowns (cross-down 13W MA)
IWF - iShares Russell 1000 Growth ETF · 13W perf: +15.4%
VWO - Vanguard FTSE Emerging Markets Index ETF · +11.7%
EWG - iShares MSCI Germany ETF · +8.8%
XLY - Consumer Discretionary Select Sector · +8.4%
COPX - Global X Copper Miners ETF · +6.4%
↗ Leadership gains (cross-up 13W MA vs SPY)
XLU - Utilities Select Sector · 13W relative perf: -11.5%
XLP - Consumer Staples Select Sector · -9.5%
SCHD - Schwab U.S. Dividend Equity ETF · -7.8%
DVY - iShares Select Dividend ETF · -7.5%
SDY - SPDR S&P Dividend ETF · -7.4%
INDA - iShares MSCI India ETF · -6.2%
VYM - Vanguard High Dividend Yield Index ETF · -5.2%
SPYV - S&P 500 Value ETF · -5.0%
EFA - iShares MSCI EAFE ETF · -3.7%
VIG - Vanguard Dividend Appreciation Index ETF · -3.4%
RSP - Invesco S&P 500 Equal Weight ETF · -2.8%
XLV - Health Care Select Sector · -2.5%
XLF - Financial Select Sector · -2.4%
VO - Vanguard Mid-Cap Index ETF · -1.5%
MDYV - SPDR S&P 400 Mid Cap Value ETF · -1.3%
XLRE - The Real Estate Select Sector · -1.0%
QUAL - iShares MSCI USA Quality Factor ETF · -0.9%
↘ Leadership losses (cross-down 13W MA vs SPY)
SPYG - S&P 500 Growth ETF · 13W relative perf: +5.1%
VWO - Vanguard FTSE Emerging Markets Index ETF · -3.1%
FIXED INCOME
↗ Price breakouts (cross-up 13W MA)
IEI - iShares 3-7 Year Treasury Bond ETF · 13W perf: +0.8%
VGIT - Vanguard Intermediate-Term Treasury Index ETF · +1.0%
TIP - iShares TIPS Bond ETF · +1.7%
↘ Price breakdowns (cross-down 13W MA)
PFF - iShares Preferred and Income Securities ETF · 13W perf: +2.0%
↗ Leadership gains (cross-up 13W MA vs AGG)
VCIT - Vanguard Intermediate-Term Corporate Bond Index ETF · 13W relative perf: +0.6%
↘ Leadership losses (cross-down 13W MA vs AGG)
JNK - SPDR Bloomberg High Yield Bond ETF · 13W relative perf: +1.2%
HYG - iShares iBoxx $ High Yield Corporate Bond ETF · +1.1%
PFF - iShares Preferred and Income Securities ETF · +0.2%
SPECIALTY
↗ Price breakouts (cross-up 13W MA)
USMV - iShares MSCI USA Min Vol Factor ETF · 13W perf: +5.7%
↘ Price breakdowns (cross-down 13W MA)
ICLN - iShares Global Clean Energy ETF · 13W perf: +9.5%
FTLS - First Trust Long/Short Equity ETF · +5.6%
DBMF - iMGP DBi Managed Futures Strategy ETF · +0.5%
↗ Leadership gains (cross-up 13W MA vs SPY)
USMV - iShares MSCI USA Min Vol Factor ETF · 13W relative perf: -8.3%
VNQ - Vanguard Real Estate Index ETF · -0.7%
REET - iShares Global REIT ETF · -0.6%
IBB - iShares Biotechnology ETF · +1.3%
↘ Leadership losses (cross-down 13W MA vs SPY)
None for the week
COMMODITIES
↗ Price breakouts (cross-up 13W MA)
None for the week
↘ Price breakdowns (cross-down 13W MA)
CPER - United States Copper LP · 13W perf: +11.6%
↗ Leadership gains (cross-up 13W MA vs SPY)
None for the week
↘ Leadership losses (cross-down 13W MA vs SPY)
None for the week
Romain Gandon
CEO, Quantlake
Disclaimer: This article is for informational and educational purposes only and does not constitute investment advice. Past performance is not indicative of future results.