.png)
Intermediate Trends: Equity Leadership Narrows as Price Participation Expands
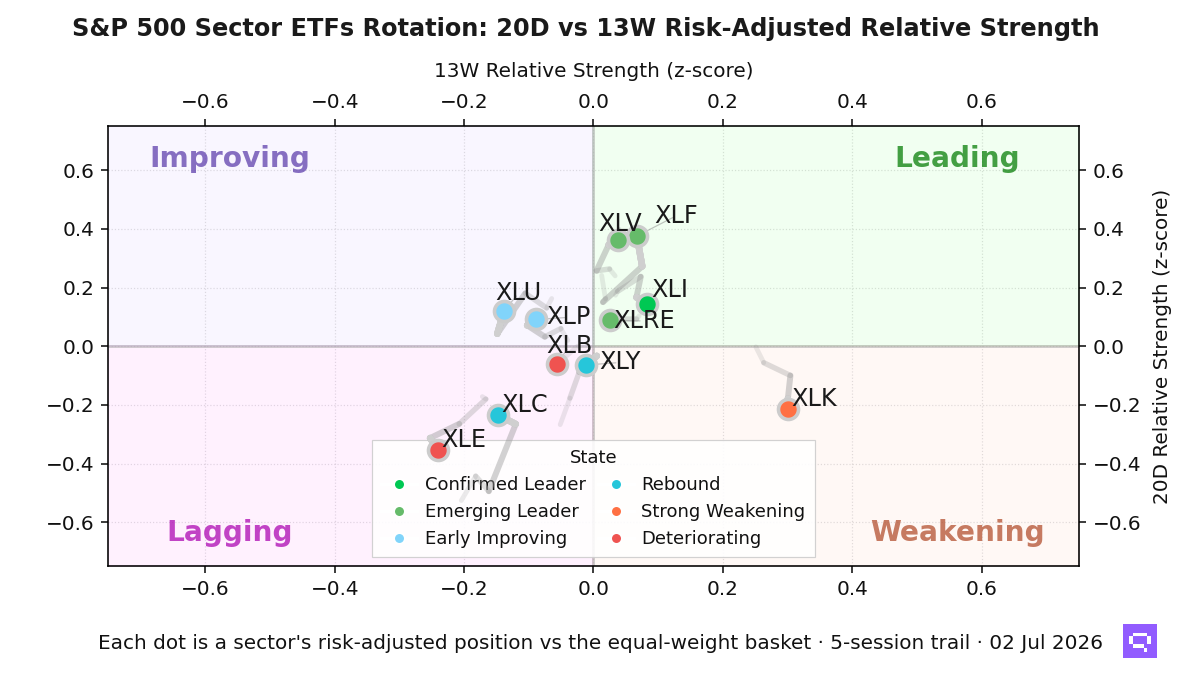
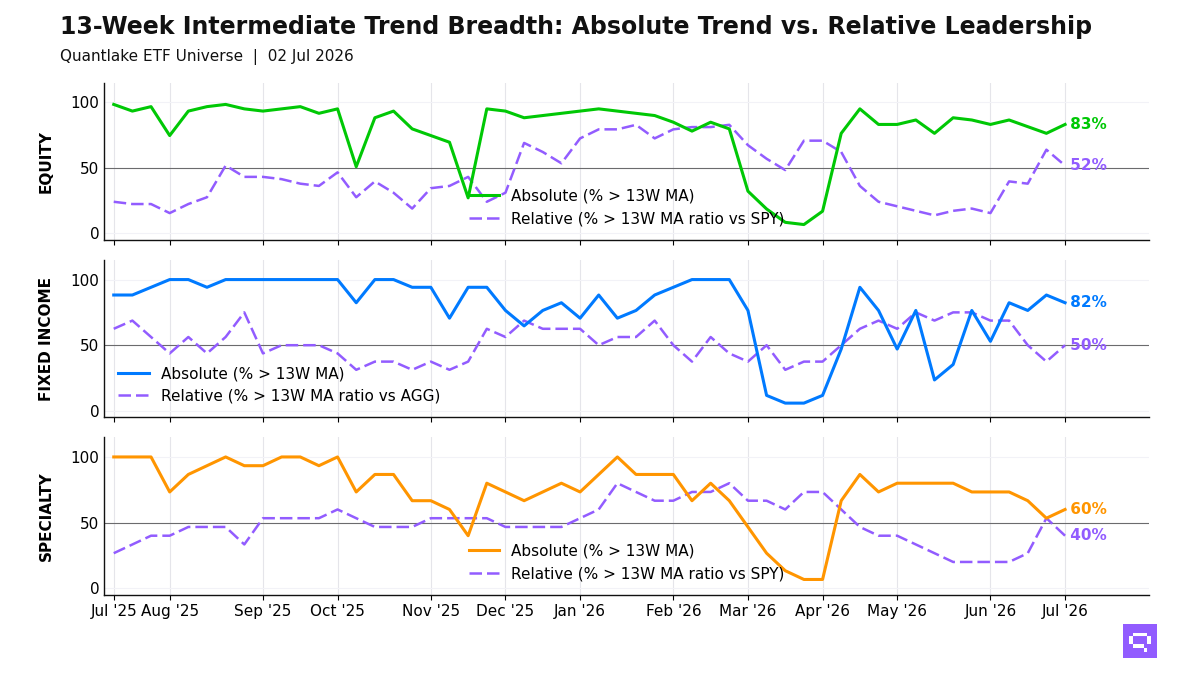
Price recovery outran benchmark leadership across our ETF universe
As of July 2, 49 of 59 equity ETFs (83%, +6.8pp on the week) sat above their 13-week moving average (13W MA), and only 30 of 58 beat the S&P 500 SPY on a 13-week ratio moving average vs SPY (13W ratio MA vs SPY) basis (52%, -12.1pp), a 31pp price-relative gap. US equity, equal-weight, and quality held the relative winners. Asia-Pacific leadership came through Taiwan equity and Japan. Emerging markets, the United Kingdom, Germany, South Korea, value, and momentum lost relative ground. The equity tape is benchmark-led, with price participation outrunning relative leadership.
Fixed income rotated toward credit and short duration over the week, with High Yield HYG, High Yield Bonds JNK, and Short Corporate VCSH crossing above their 13W ratio MA vs Aggregate Bonds AGG as Long Treasuries TLT crossed below it and TIPS TIP fell below its 13W MA. Government bonds and long duration sat above their price averages in several cases. Benchmark outperformance concentrated in credit, EM debt, investment grade, and munis. The bond tape is a price rebound with leadership in credit and a rate-sensitive lag in duration.
Specialty participation took on a breadth-trap shape over the week, with Biotech IBB, real estate, and semiconductors leading relative to the S&P 500 SPY as Long/Short Equity FTLS, Covered Calls Nasdaq JEPQ, and Infrastructure PAVE recovered in price without benchmark confirmation. Commodity signals were absent in the alerts. Cross-timescale weakness sat in oil, broad commodities, copper, and silver. The specialty and commodity mix is selective, with equity-linked winners offset by hard-asset weakness.
13-Week Intermediate Breadth
Key Takeaways
Cross-timescale equity alignment reached 71%, and the relative leaders clustered in value-tilted US equity and quality through DIA, DVY, IJR, IWM, MDYV and QUAL. Global miners COPX, China FXI, Developed ex-US IDV and Intl Momentum IMTM aligned weak across daily, weekly and monthly windows. The equity distribution rewards selective domestic and quality leadership.
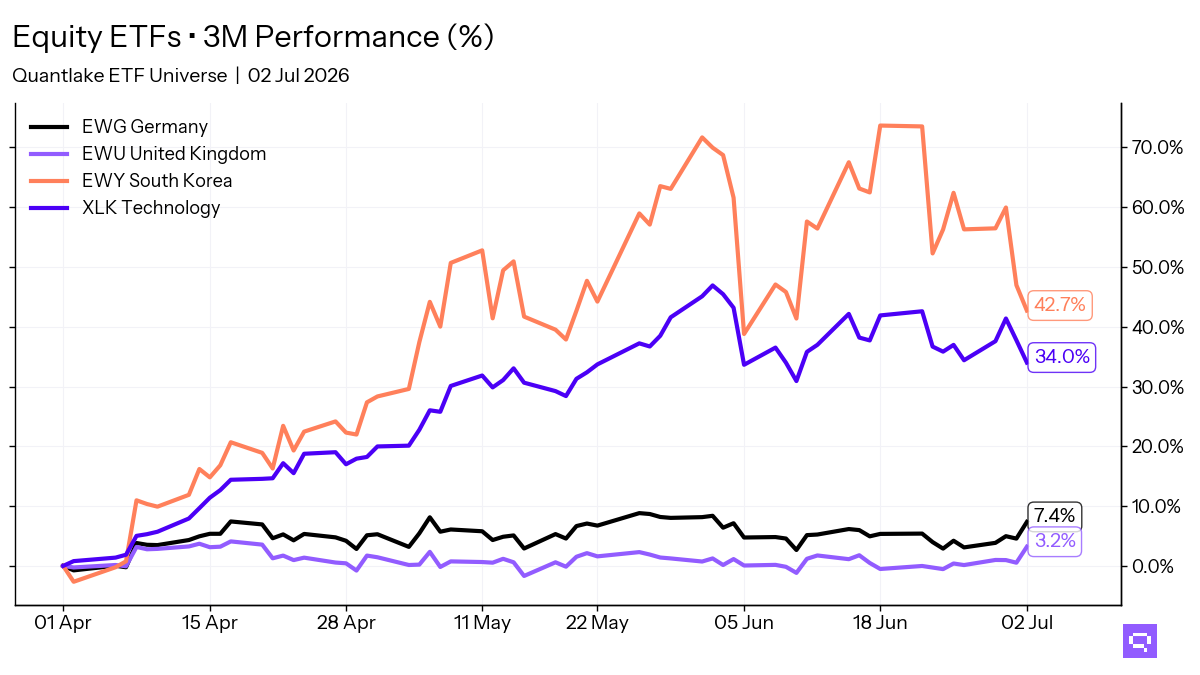
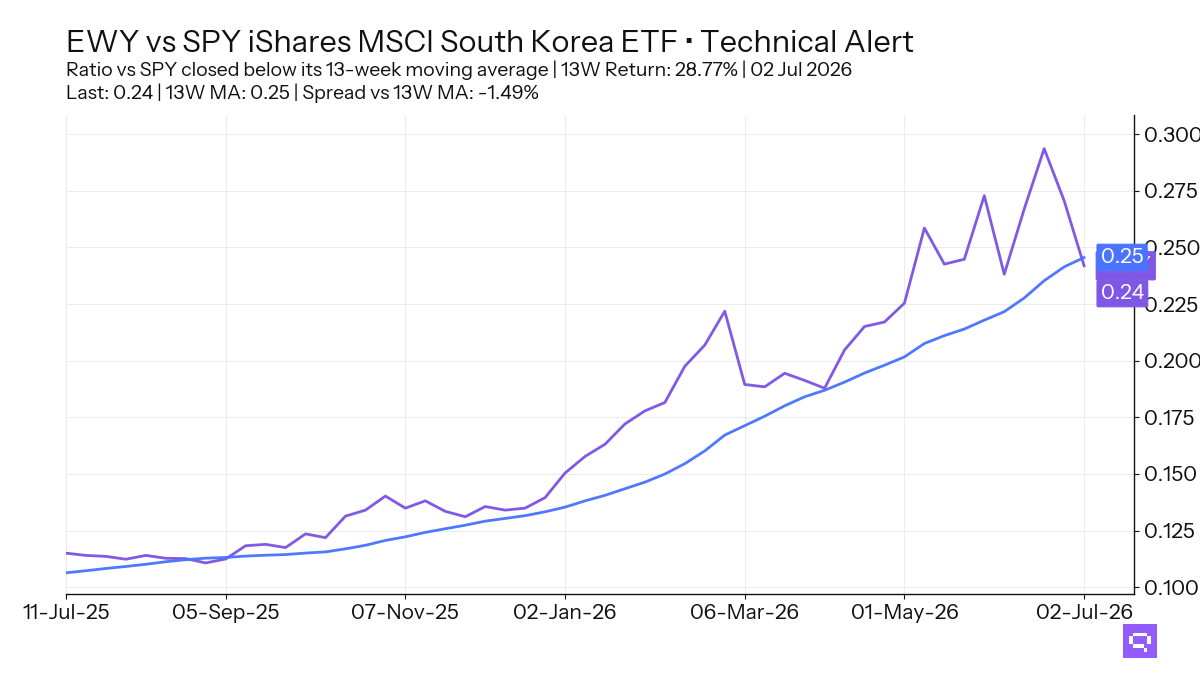
South Korea EWY, up 28.77% relative to SPY over the period, crossed below its 13-week ratio moving average vs SPY. Emg. Markets EEM and Developed Markets VEA also crossed below their 13W ratio MA vs SPY. Europe VGK and MSCI World URTH crossed above it from negative 13-week returns. The international relative tape shows fading EM leadership and early developed-market repair.
Fixed income cross-timescale alignment reached 65%, with International Aggregate BNDX, EM Debt EMB, high yield, munis and short corporate bonds aligned strong against Aggregate Bonds AGG. Long Treasuries TLT, TIPS TIP and Preferred PFF sat on the weak side of that split, even though several Treasury ETFs held above their 13W MA in price. The bond distribution favors credit and short duration, and the rate-sensitive end lacks relative sponsorship.
FEATURED ETF: iShares MSCI South Korea ETF EWY vs SPY
Other Technical Signal Events
EQUITY
↗ Price breakouts (cross-up 13W MA)
ACWV - iShares MSCI Global Min Vol Factor ETF · 13W perf: +2.7%
EWU - iShares MSCI United Kingdom ETF · +3.5%
EWG - iShares MSCI Germany ETF · +8.2%
VWO - Vanguard FTSE Emerging Markets Index ETF · +9.8%
↘ Price breakdowns (cross-down 13W MA)
None for the week
↗ Leadership gains (cross-up 13W MA vs SPY)
IQLT - iShares MSCI Intl Quality Factor ETF · 13W relative perf: -5.1%
VGK - Vanguard FTSE Europe Index ETF · -4.4%
URTH - iShares MSCI World ETF · -1.4%
↘ Leadership losses (cross-down 13W MA vs SPY)
EWY - iShares MSCI South Korea ETF · 13W relative perf: +28.8%
EEM - iShares MSCI Emerging Markets ETF · +2.5%
VT - Vanguard Total World Stock Index ETF · -1.2%
VEA - Vanguard FTSE Developed Markets Index ETF · -3.3%
IMTM - iShares MSCI Intl Momentum Factor ETF · -4.4%
VYM - Vanguard High Dividend Yield Index ETF · -4.8%
XLRE - The Real Estate Select Sector · -4.9%
INDA - iShares MSCI India ETF · -6.7%
XLP - Consumer Staples Select Sector · -8.2%
XLU - Utilities Select Sector · -12.7%
FIXED INCOME
↗ Price breakouts (cross-up 13W MA)
None for the week
↘ Price breakdowns (cross-down 13W MA)
TIP - iShares TIPS Bond ETF · 13W perf: +0.4%
↗ Leadership gains (cross-up 13W MA vs AGG)
VCSH - Vanguard Short-Term Corporate Bond Index ETF · 13W relative perf: +0.3%
HYG - iShares iBoxx $ High Yield Corporate Bond ETF · +1.3%
JNK - SPDR Bloomberg High Yield Bond ETF · +1.6%
↘ Leadership losses (cross-down 13W MA vs AGG)
TLT - iShares 20+ Year Treasury Bond ETF · 13W relative perf: -0.7%
SPECIALTY
↗ Price breakouts (cross-up 13W MA)
FTLS - First Trust Long/Short Equity ETF · 13W perf: +5.1%
↘ Price breakdowns (cross-down 13W MA)
None for the week
↗ Leadership gains (cross-up 13W MA vs SPY)
None for the week
↘ Leadership losses (cross-down 13W MA vs SPY)
PAVE - Global X U.S. Infrastructure Development ETF · 13W relative perf: -2.0%
JEPQ - JPMorgan Nasdaq Equity Premium Income ETF · -3.3%
COMMODITIES
No event for the week
Romain Gandon
CEO, Quantlake
Disclaimer: This article is for informational and educational purposes only and does not constitute investment advice. Past performance is not indicative of future results.