.png)
Intermediate Trends: Equal Weight Breaks as Equity Leadership Narrows
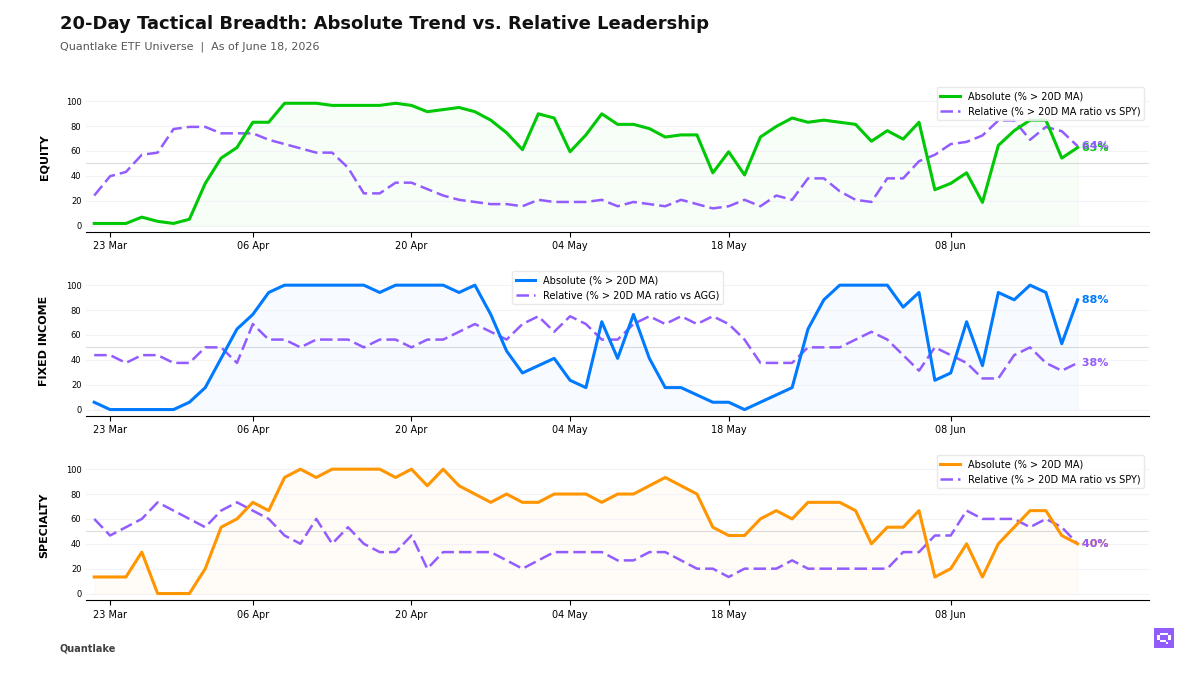
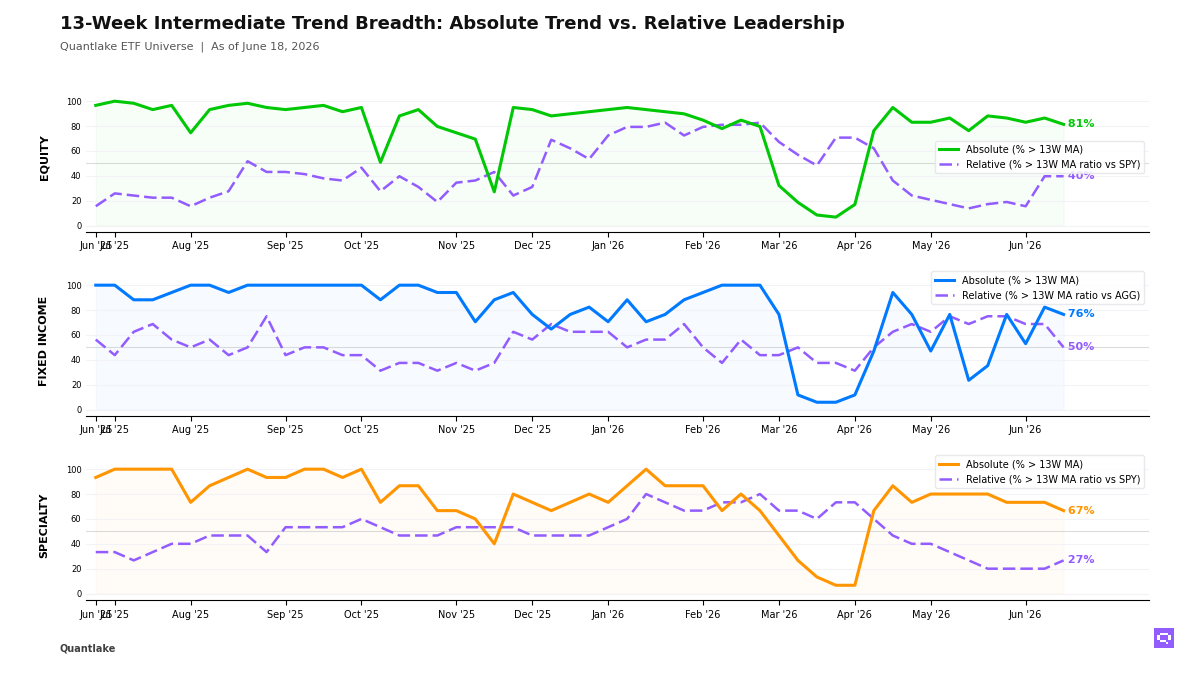
Price breadth is high, but only 40% beat SPY
As of June 18, equal-weight and style participation weakened across our ETF universe even with 48 of 59 equity ETFs (81%, -5.1pp) above their 13-week moving average (13W MA). Equal Weight S&P 500 RSP and Quality Factor QUAL crossed below their 13-week ratio moving average vs S&P 500 SPY (13W ratio MA vs SPY). Only 23 of 58 equity ETFs (40%, unchanged) beat SPY, a 42pp abs/rel gap, as US size, Asia-Pacific, emerging markets, and momentum carried the winners while low-volatility, dividend, China, United Kingdom, and defensive sectors lagged. The equity tape is benchmark-led rather than broad.
Fixed income lost relative participation even with 13 of 17 ETFs (76%, -5.9pp) above the 13W MA. Only 8 of 16 beat the Aggregate Bonds AGG (50%, -18.8pp), a 26pp gap, as EM debt, high yield, investment grade, munis, and long duration led the benchmark while intermediate Treasuries, short corporates, mortgages, and inflation-linked exposure lagged. The bond move is a price recovery concentrated in credit and selected duration.
Specialty leadership narrowed as 10 of 15 ETFs (67%, -6.7pp) held above the 13W MA, but only 4 of 15 beat the S&P 500 SPY (27%, +6.7pp) as Semiconductors SMH carried the winners while gold, miners, bitcoin, real estate, managed futures, and low-volatility lagged. Copper CPER crossed below its 13W ratio MA vs SPY, and commodity weakness also ran through silver. The specialty and commodity mix favors a narrow growth pocket rather than broad hard-asset leadership.
13-Week Intermediate Breadth
Key Takeaways
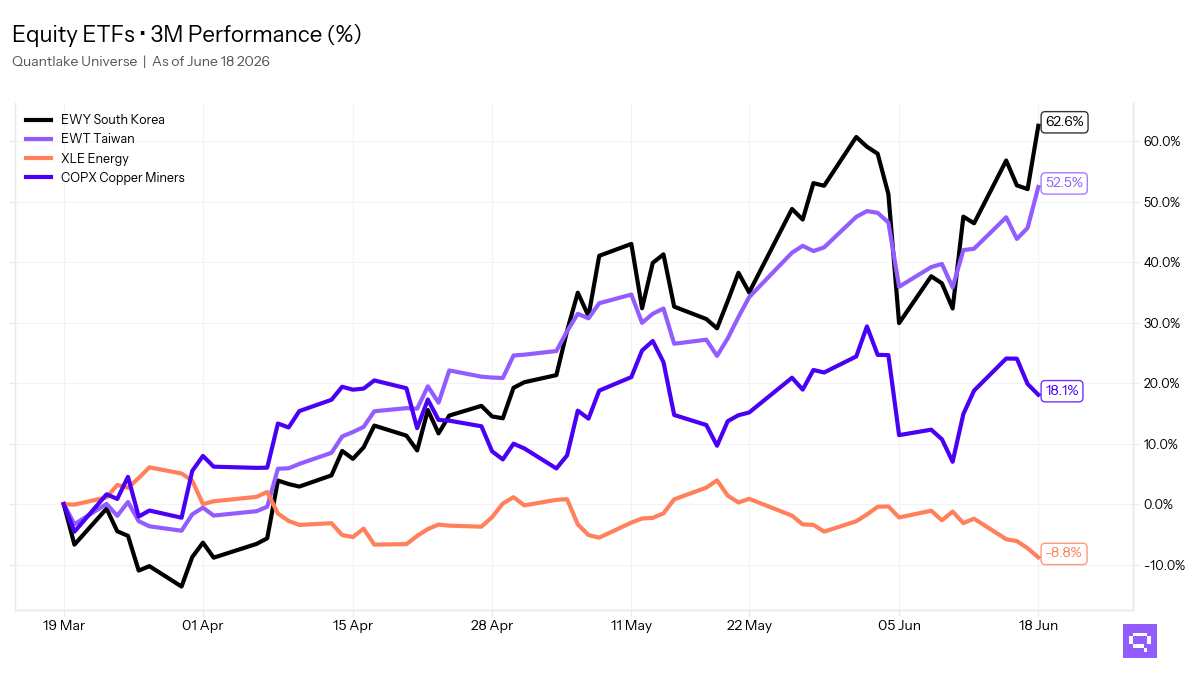
Japan EWJ, Taiwan EWT, South Korea EWY, and Emerging Markets VWO align as relative leaders across daily, weekly, and monthly windows versus the S&P 500 SPY. Global Min Vol ACWV, Germany EWG, and Consumer Staples XLP align in the opposing cluster, and XLP crossed below its 13W MA during the week just closed. The equity split favors regional beta and momentum over defensive and income exposure.
Long-duration TLT, International Aggregate BNDX, EM Debt EMB, and Muni Broad MUB align as relative leaders versus the Aggregate Bonds AGG across daily, weekly, and monthly windows. Mortgage-Backed MBB, Corporate Credit VCIT, and Short Corporate VCSH fell below their 13W ratio MA versus AGG during the week, and TIPS TIP fell below its 13W MA. The bond hierarchy rewards credit and long duration over intermediate duration and inflation-linked stability.
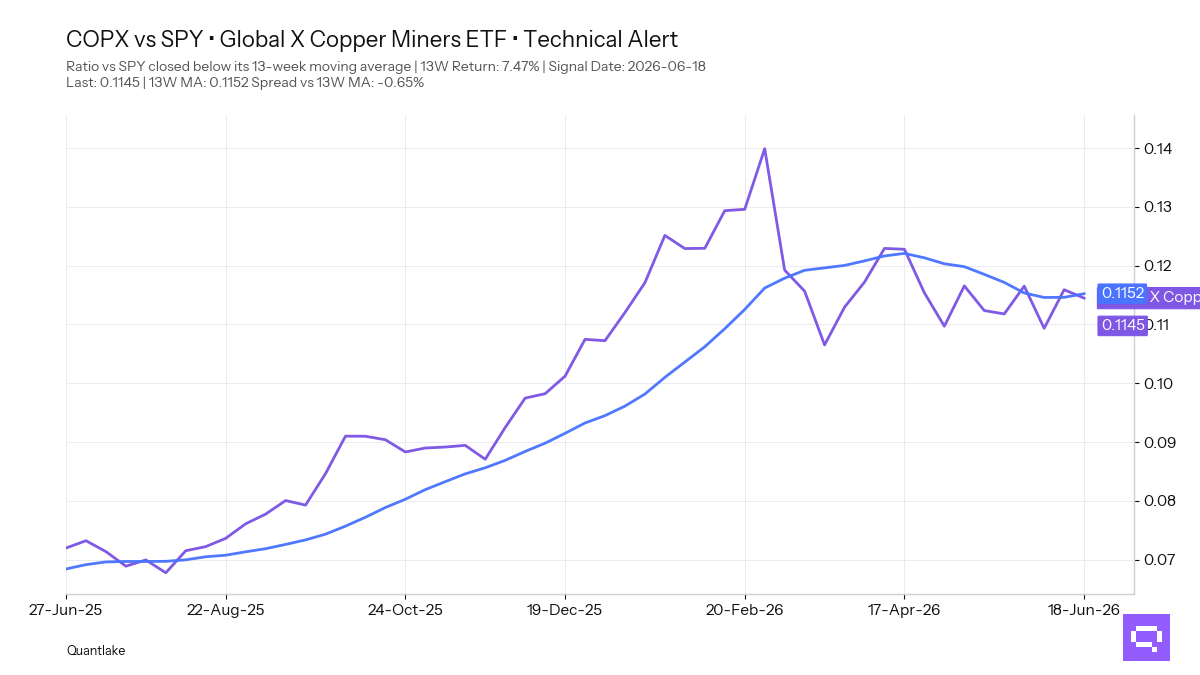
Copper Miners COPX, with a +7.47% period relative return versus SPY, crossed below its 13-week ratio moving average. Copper CPER also crossed below its 13W ratio MA versus SPY after a +4.33% 13-week return. The copper complex loses relative sponsorship after a positive trailing run.
FEATURED ETF: Global X Copper Miners ETF COPX vs SPY
Other Technical Signal Events
EQUITY
↗ Price breakouts (cross-up 13W MA)
INDA - iShares MSCI India ETF · 13W perf: +6.4%
↘ Price breakdowns (cross-down 13W MA)
IDV - iShares International Select Dividend ETF · 13W perf: +5.9%
EWU - iShares MSCI United Kingdom ETF · +5.2%
XLP - Consumer Staples Select Sector · +3.0%
ACWV - iShares MSCI Global Min Vol Factor ETF · +1.9%
↗ Leadership gains (cross-up 13W MA vs SPY)
XLI - Industrial Select Sector · 13W relative perf: -2.5%
VWO - Vanguard FTSE Emerging Markets Index ETF · +0.5%
IMTM - iShares MSCI Intl Momentum Factor ETF · +2.0%
EWJ - iShares MSCI Japan ETF · +3.5%
↘ Leadership losses (cross-down 13W MA vs SPY)
COPX - Global X Copper Miners ETF · 13W relative perf: +7.5%
MDYV - SPDR S&P 400 Mid Cap Value ETF · -1.5%
QUAL - iShares MSCI USA Quality Factor ETF · -2.1%
RSP - Invesco S&P 500 Equal Weight ETF · -3.9%
FIXED INCOME
↗ Price breakouts (cross-up 13W MA)
IEF - iShares 7-10 Year Treasury Bond ETF · 13W perf: +0.4%
↘ Price breakdowns (cross-down 13W MA)
TIP - iShares TIPS Bond ETF · 13W perf: +0.9%
VTIP - Vanguard Short-Term Inflation-Protected Securities Index ETF · +0.6%
↗ Leadership gains (cross-up 13W MA vs AGG)
None for the week
↘ Leadership losses (cross-down 13W MA vs AGG)
VCIT - Vanguard Intermediate-Term Corporate Bond Index ETF · 13W relative perf: +0.4%
MBB - iShares MBS ETF · +0.2%
VCSH - Vanguard Short-Term Corporate Bond Index ETF · -0.2%
SPECIALTY
↗ Price breakouts (cross-up 13W MA)
None for the week
↘ Price breakdowns (cross-down 13W MA)
USMV - iShares MSCI USA Min Vol Factor ETF · 13W perf: +2.4%
↗ Leadership gains (cross-up 13W MA vs SPY)
JEPQ - JPMorgan Nasdaq Equity Premium Income ETF · 13W relative perf: -1.6%
↘ Leadership losses (cross-down 13W MA vs SPY)
None for the week
COMMODITIES
↗ Price breakouts (cross-up 13W MA)
None for the week
↘ Price breakdowns (cross-down 13W MA)
None for the week
↗ Leadership gains (cross-up 13W MA vs SPY)
None for the week
↘ Leadership losses (cross-down 13W MA vs SPY)
CPER - United States Copper LP · 13W relative perf: +4.3%
Romain Gandon
CEO, Quantlake
Disclaimer: This article is for informational and educational purposes only and does not constitute investment advice. Past performance is not indicative of future results.