.png)

Intermediate Trends: Equal-Weight and Small-Cap Break Lower This Week
Price participation now outruns relative leadership across equities
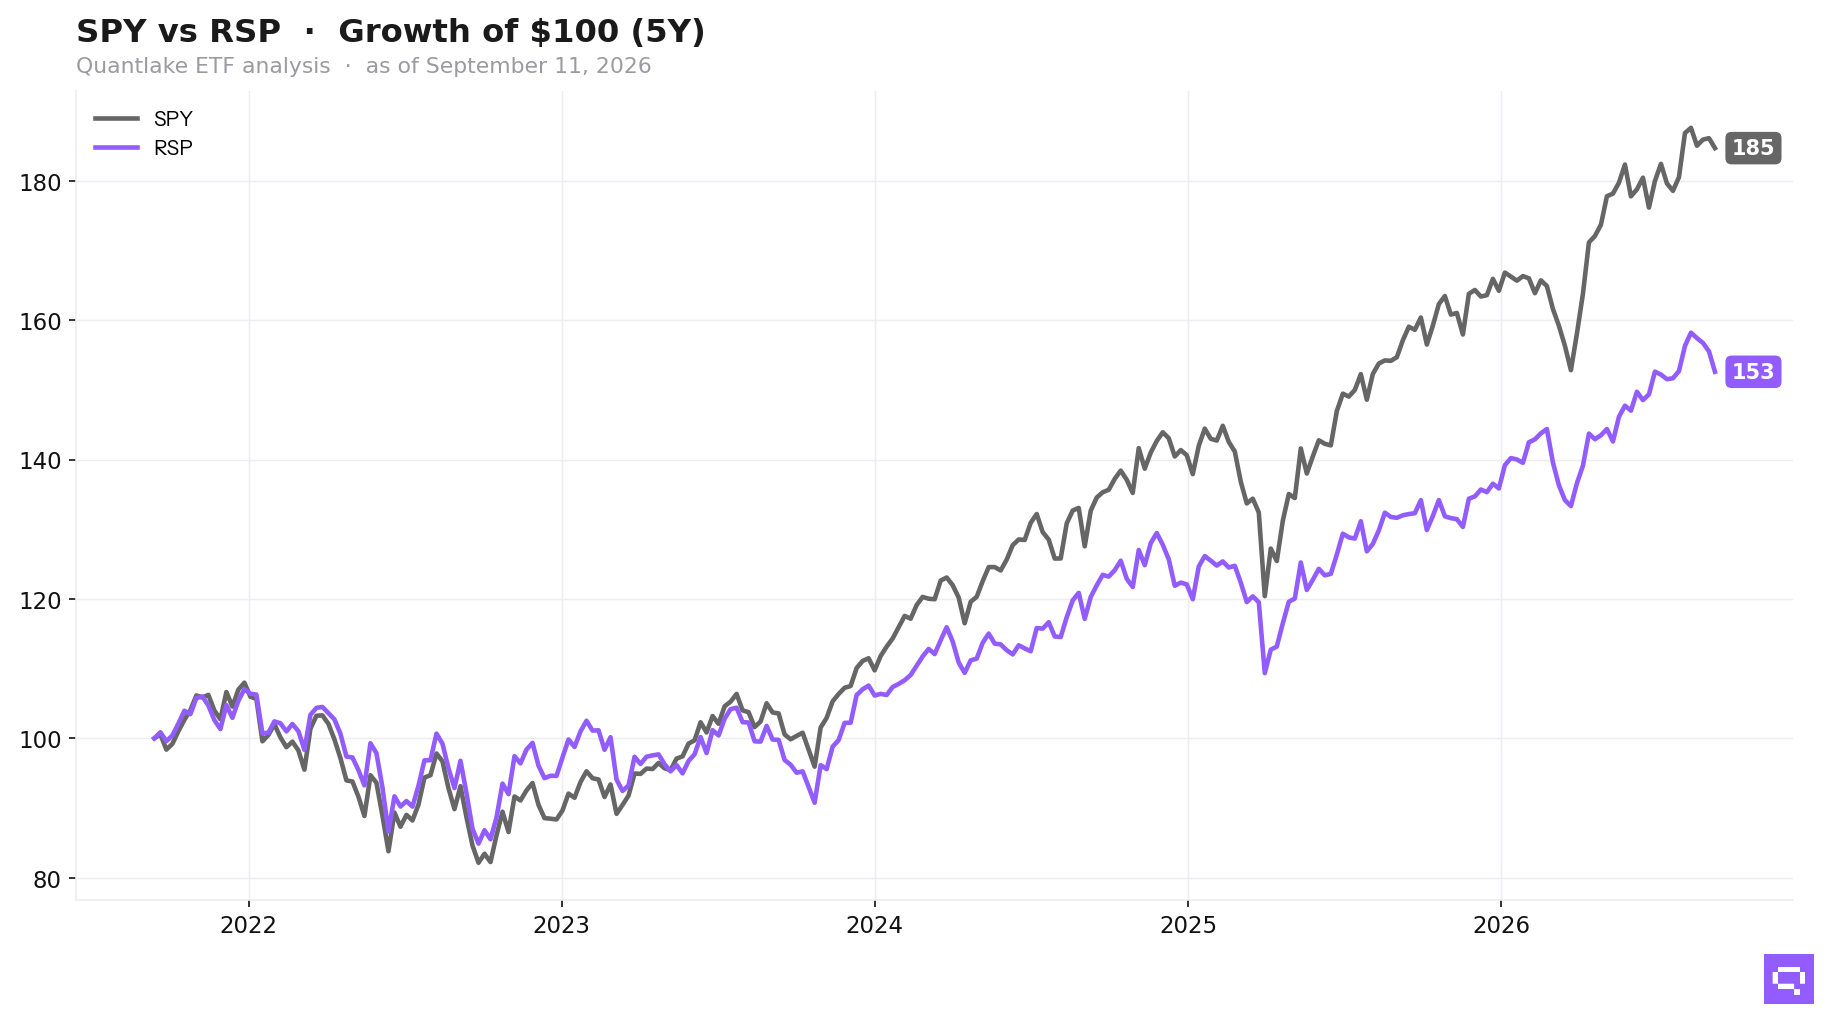
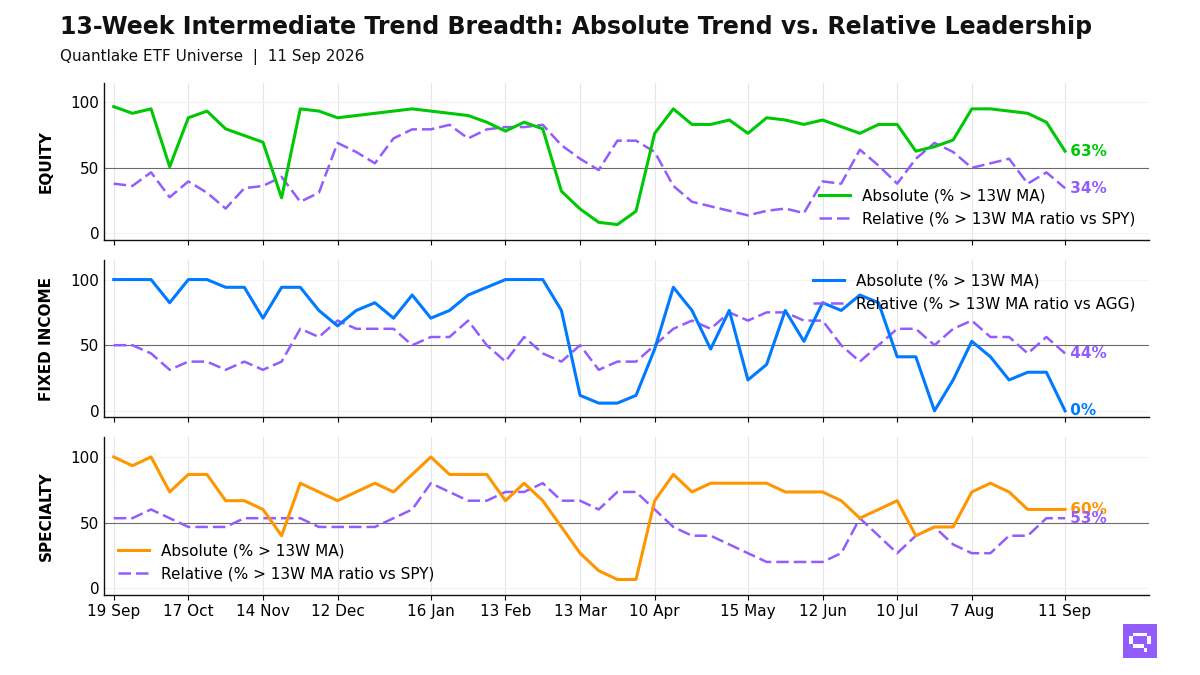
Equal Weight S&P 500 RSP and Small-Cap VB crossed below their 13-week averages by the September 11 close, and 37 of 59 equity ETFs (63%, -22.0pp on the week) hold above their 13-week moving average (13W MA) while 20 of 58 (34%, -12.1pp) outperform the S&P 500 SPY. The 28pp price-relative gap narrowed from 38pp last week. Low-volatility, Asia-Pacific, and Brazil sit in both leader buckets, while U.S. size, China, and developed ex-US weakened against the benchmark. The equity configuration is selective: price participation exceeds relative leadership, and much of the surviving breadth sits in recovery rather than established leadership.
Fixed income lost price support across our coverage, with 0 of 17 above their 13-week average, and relative winners vs Aggregate Bonds AGG are limited to high yield, preferreds, and short duration. Long-duration Treasuries, mortgages, and investment grade lag the benchmark, so bond leadership concentrates in short duration and credit.
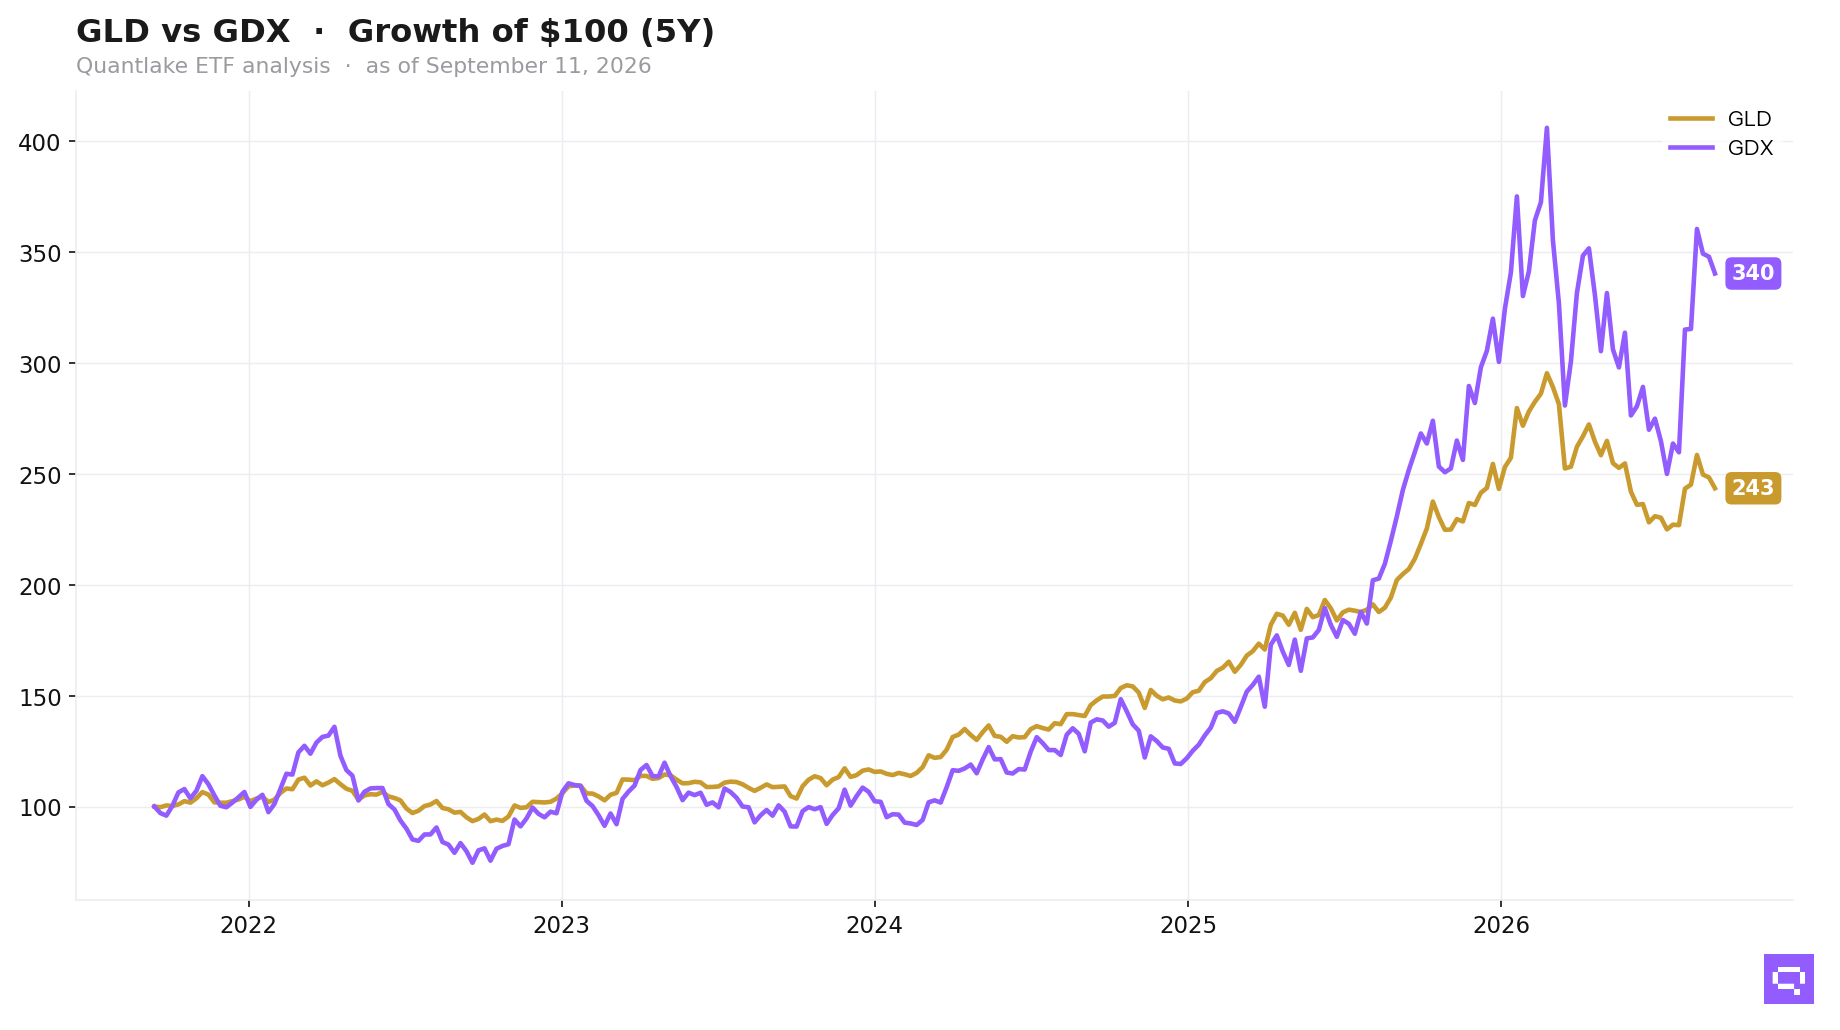
Specialty leadership clusters in 8 of 15 relative winners led by Managed Futures DBMF, gold, and bitcoin vs the S&P 500 SPY, while semiconductors, infrastructure, and real estate populate the laggard side. Oil and broad commodity exposure lead against the S&P 500 SPY, and Copper CPER crossed below its ratio moving average vs SPY, so specialty and commodity strength concentrates in alternatives and hard assets.
13-Week Intermediate Breadth
Key Takeaways
Technology XLK and Communication Services XLC crossed above their ratio moving averages vs the S&P 500 SPY even as trailing 13-week relative returns stand at down 1.58% and down 2.11%. The pair marks early relative stabilization inside U.S. growth, with negative 13-week returns leaving leadership unconfirmed.
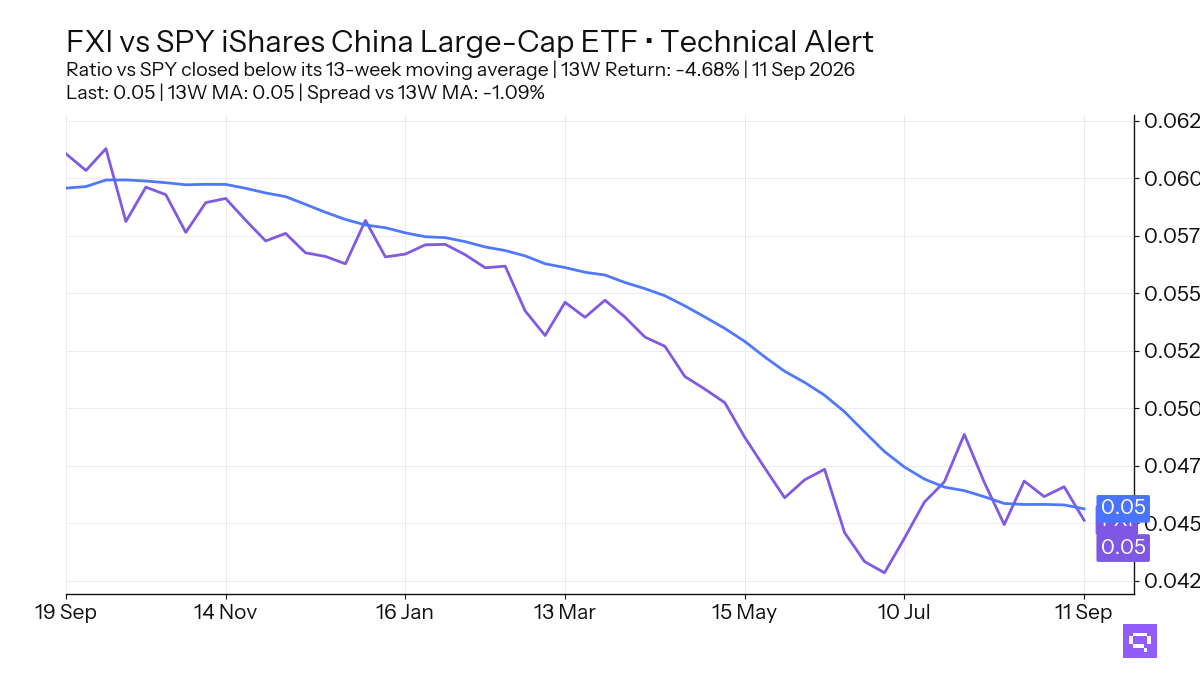
China relative leadership weakened against the S&P 500 SPY. China Large Cap FXI, down 4.68% relative to SPY over the trailing 13-week window, crossed below its 13-week ratio moving average (13W ratio MA). China MCHI also crossed below its 13-week price average. China exposure splits between price-only recovery in FXI and outright price damage in MCHI.
Fixed income alignment reaches 82% across daily, weekly, and monthly views, and relative winners vs Aggregate Bonds AGG are confined to high yield and short duration, led by High Yield HYG and Short Corporate VCSH. EM Sovereign Bonds EMB, Mortgage-Backed MBB, and long-duration Treasuries lag the benchmark. Bond leadership concentrates in shorter duration and selected credit.
FEATURED ETF: iShares China Large-Cap ETF FXI vs SPY
Other Technical Signal Events
Equity: Price vs 13-week MA
| Signal | Ticker | Name | 13W perf |
|---|---|---|---|
| Cross-down | DIA | SPDR Dow Jones Industrial Average ETF | +2.9% |
| Cross-down | VIG | Vanguard Dividend Appreciation Index ETF | +2.0% |
| Cross-down | RSP | Invesco S&P 500 Equal Weight ETF | +1.9% |
| Cross-down | VO | Vanguard Mid-Cap Index ETF | +1.8% |
| Cross-down | VGK | Vanguard FTSE Europe Index ETF | +1.8% |
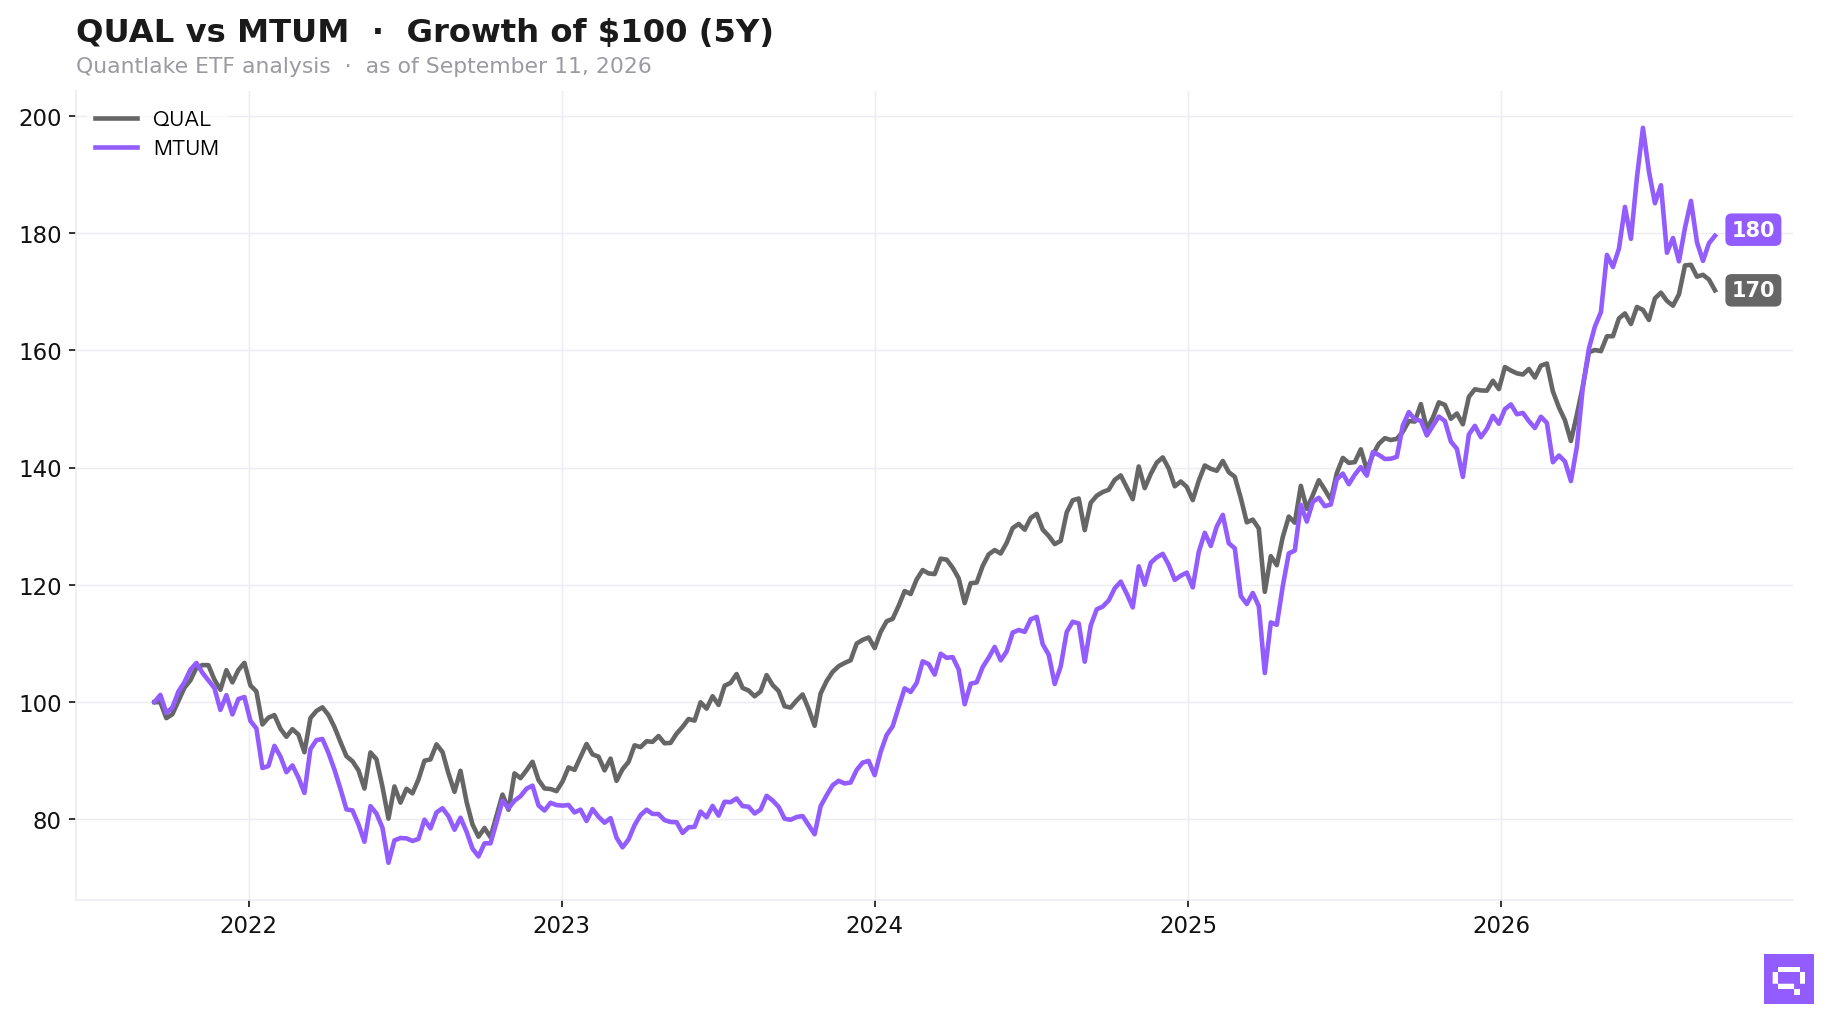
| Cross-down | QUAL | iShares MSCI USA Quality Factor ETF | +1.7% |
| Cross-down | SDY | SPDR S&P Dividend ETF | +0.9% |
| Cross-down | INDA | iShares MSCI India ETF | +0.5% |
| Cross-down | SLYV | SPDR S&P 600 Small Cap Value ETF | -0.2% |
| Cross-down | VB | Vanguard Small-Cap Index ETF | -0.7% |
| Cross-down | MDYV | SPDR S&P 400 Mid Cap Value ETF | -0.7% |
| Cross-down | XLB | Materials Select Sector | -2.0% |
| Cross-down | MCHI | iShares MSCI China ETF | -2.8% |
Equity vs SPY: Price Ratio vs 13-week MA
| Signal | Ticker | Name | 13W rel perf |
|---|---|---|---|
| Cross-up | XLC | Communication Services Select Sector | -2.1% |
| Cross-up | XLK | Technology Select Sector | -1.6% |
| Cross-down | XLV | Health Care Select Sector | +4.5% |
| Cross-down | EWG | iShares MSCI Germany ETF | unch. |
| Cross-down | URTH | iShares MSCI World ETF | unch. |
| Cross-down | EFA | iShares MSCI EAFE ETF | unch. |
| Cross-down | EWU | iShares MSCI United Kingdom ETF | -0.2% |
| Cross-down | VT | Vanguard Total World Stock Index ETF | -0.6% |
| Cross-down | IQLT | iShares MSCI Intl Quality Factor ETF | -0.6% |
| Cross-down | VWO | Vanguard FTSE Emerging Markets Index ETF | -1.8% |
| Cross-down | FXI | iShares China Large-Cap ETF | -4.7% |
Fixed Income: Price vs 13-week MA
| Signal | Ticker | Name | 13W perf |
|---|---|---|---|
| Cross-down | JNK | SPDR Bloomberg High Yield Bond ETF | -0.1% |
| Cross-down | HYG | iShares iBoxx $ High Yield Corporate Bond ETF | -0.2% |
| Cross-down | VTIP | Vanguard Short-Term Inflation-Protected Securities Index ETF | -0.3% |
| Cross-down | VCSH | Vanguard Short-Term Corporate Bond Index ETF | -0.4% |
| Cross-down | PFF | iShares Preferred and Income Securities ETF | -1.6% |
Fixed Income vs AGG: Price Ratio vs 13-week MA
| Signal | Ticker | Name | 13W rel perf |
|---|---|---|---|
| Cross-down | EMB | iShares J.P. Morgan USD Emerging Markets Bond ETF | unch. |
| Cross-down | MBB | iShares MBS ETF | -0.3% |
Specialty vs SPY: Price Ratio vs 13-week MA
| Signal | Ticker | Name | 13W rel perf |
|---|---|---|---|
| Cross-up | DBMF | iMGP DBi Managed Futures Strategy ETF | +1.0% |
| Cross-down | USMV | iShares MSCI USA Min Vol Factor ETF | +0.7% |
Commodities vs SPY: Price Ratio vs 13-week MA
| Signal | Ticker | Name | 13W rel perf |
|---|---|---|---|
| Cross-down | CPER | United States Copper LP | -4.1% |
Romain Gandon
CEO, Quantlake
Disclaimer: This article is for informational and educational purposes only and does not constitute investment advice. Past performance is not indicative of future results.