.png)
How Quantlake Portfolios Performed in 2Q
Welcome to Portfolio Insights, your overview of the 2Q and year-to-date performance of Quantlake’s Classic and Smart portfolios.
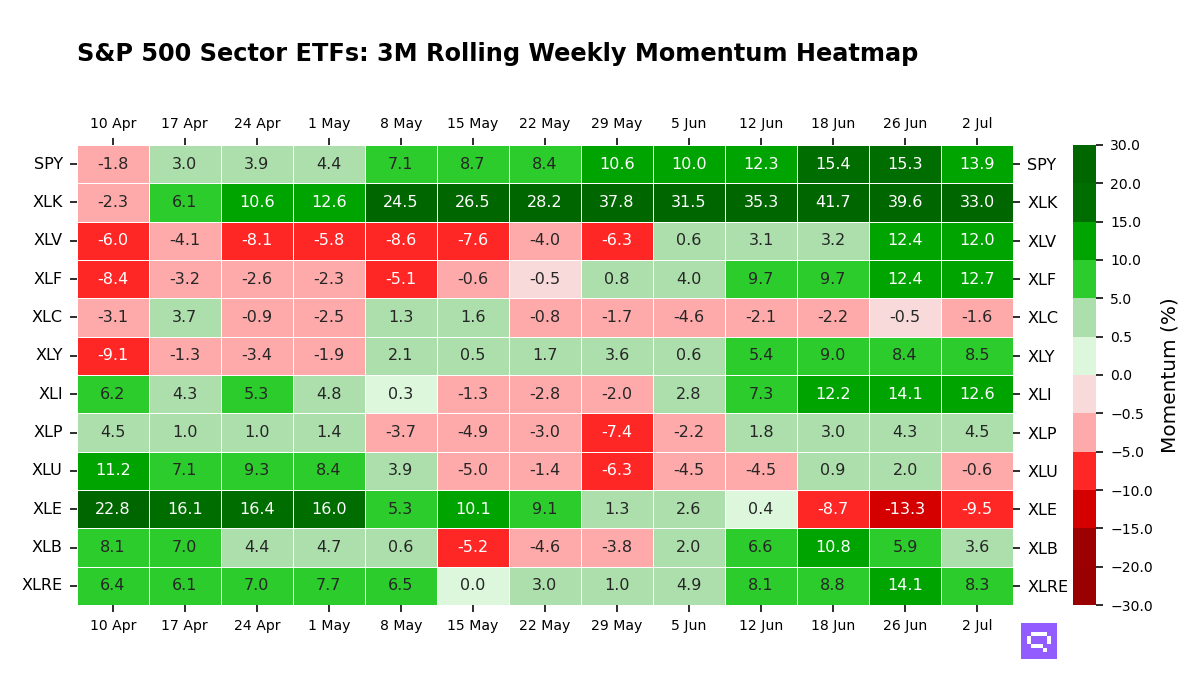
Markets favored equities this quarter, with the S&P 500 gaining 10.8%. Our growth-tilted and leveraged strategies kept pace, while defensive models reflected their cautious design.
Our Classic portfolios delivered measured results this quarter, with global diversification showing quiet strength. The Global Buffett-Inspired and US Buffett-Inspired portfolios both returned 10.5%, aligning closely with the S&P 500’s 10.8%, while maintaining their characteristic equity dominance paired with fixed income balance. The Global 80/20 and US 80/20 portfolios, favoring growth with strategic bond allocation, followed at 9.3% and 9.5%, respectively. More stability-oriented approaches like All Weather-Inspired and Browne-Inspired stayed moderate, up 3.7% and 3.6%, underscoring their defensive tilt relative to broad market gains.

In the Smart category, strategies designed for enhanced exposure naturally stood out. US Leverage Growth advanced 23.4%, with Aggressive Plus leading at 24.1%, both reflecting their leveraged structures. Innovation-focused models also contributed, as Innovation Ventures & Crypto and Innovation Ventures returned 17.7% and 17.2%, supported by exposure to dynamic sectors. Portfolios with a balanced, data-driven design such as Growth & Stability and Core Trio posted steady 13.8% and 13.6% gains, comfortably ahead of the AOR’s 7.4% and AOA’s 9.3%. Meanwhile, more defensively positioned models like Conservative Plus remained subdued, consistent with their emphasis on stability over growth.

Takeaways
Diversification and disciplined rebalancing remain at the core of our approach, helping us navigate cycles with patience and systematic focus.
Happy Long-Term Investing!
Romain Gandon, CEO & Founder of Quantlake
🔗 LinkedIn
Disclaimer: Past performance is no guarantee of future results. Results are simulated, actual results may differ based on many factors such as liquidity, transaction costs, tax. Always use your best judgment and exercice caution when making financial decisions. You should read our T&C for more information.