.png)
Dividend ETFs Lead as Breadth Weakens, Growth Stabilizes
Momentum leadership across the ETFs we track remains anchored in dividend and income exposures, while large-cap growth stays at the back of the pack. After last week’s uniform cooling, this week brought a small pocket of stabilization within growth even as the broader universe continued to decelerate.
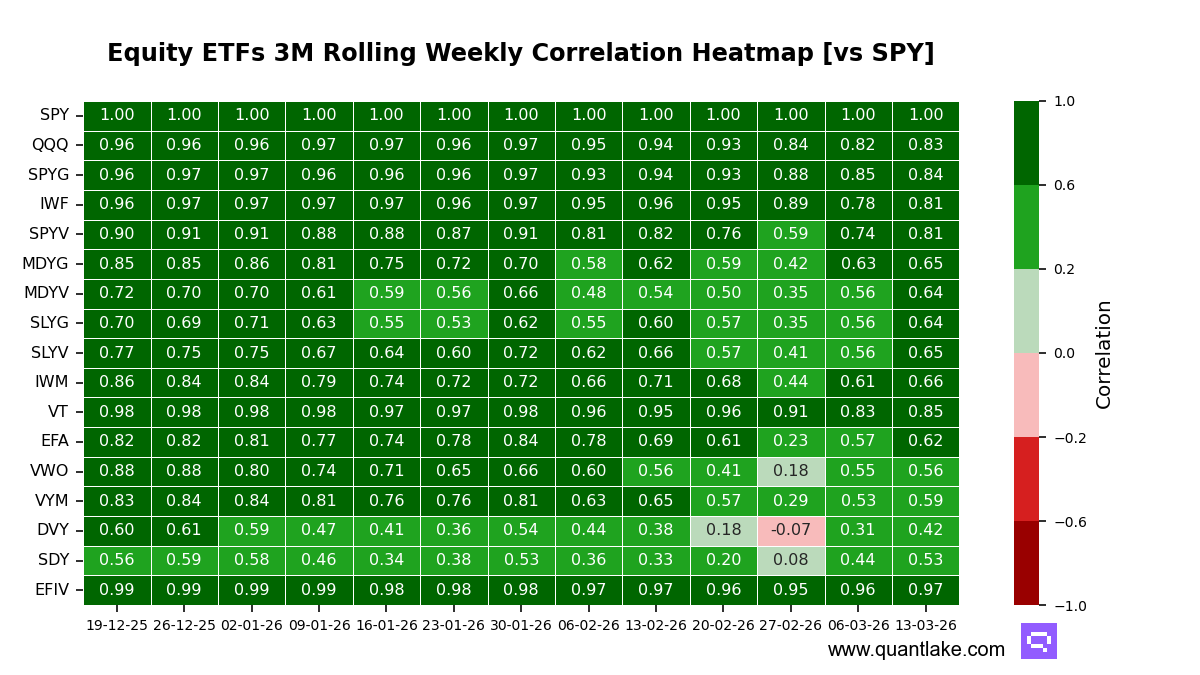
The regime reads less like a single beta tape, as key leaders show lower correlation to SPY than their 1-year mean alongside sizable alpha contribution. iShares Select Dividend ETF (DVY) shows correlation to SPY of 0.42 versus 0.68, with 7.1 points of alpha contribution. SPDR S&P Dividend ETF (SDY) shows correlation to SPY of 0.53 versus 0.65, with 7.8 points of alpha contribution.
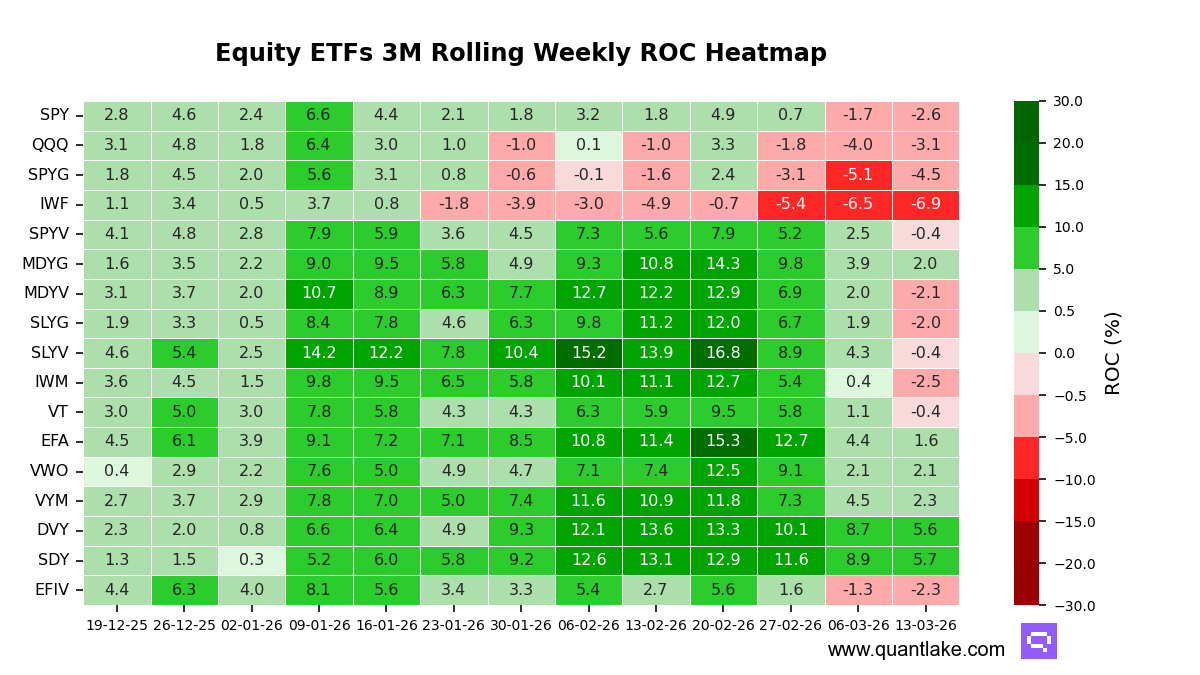
Over the week, breadth weakened again, with most constituents posting lower 3-month trailing momentum. Invesco QQQ Trust (QQQ) rose +0.9 points, SPDR Portfolio S&P 500 Growth ETF (SPYG) rose +0.6 points. SPDR Portfolio S&P 600 Small Cap Value ETF (SLYV) fell -4.7 points, SPDR Portfolio S&P 400 Mid Cap Value ETF (MDYV) fell -4.1 points, and SPDR Portfolio S&P 600 Small Cap Growth ETF (SLYG) fell -3.9 points. Vanguard Total World Stock ETF (VT) flipped negative, alongside SPDR Portfolio S&P 500 Value ETF (SPYV) and iShares Russell 2000 ETF (IWM).
In level terms, SDY and DVY sit in the top decile, with Vanguard High Dividend Yield ETF (VYM) and VWO in the upper third. iShares MSCI EFA ETF (EFA) and SPDR Portfolio S&P 400 Mid Cap Growth ETF (MDYG) also remain positive, while QQQ and SPYG sit in the lower half and remain below zero alongside iShares Russell 1000 Growth ETF (IWF).
Stretch remains contained on our 1-year Z-score lens, with no statistically stretched or statistically depressed readings. EFA looks the most depressed but not extreme at -1.41.
Attribution continues to point to idiosyncratic leadership at the top: DVY and SDY pair decoupling correlation to SPY with large alpha contribution, consistent with better diversification and wider internal dispersion. At the other end, SPDR S&P 500 ESG (EFIV) shows correlation to SPY of 0.97 versus 0.99 with just 0.5 points of alpha, behaving more like a beta proxy.
Our take: Last week’s view of dividend-led leadership anchored in alpha still holds, but this week’s sign flips in value and small caps sharpen the breadth warning even as growth’s week-over-week pressure eased at the margin.
Fixed income momentum remains intact but less cohesive, with duration no longer holding a clear lead and credit slipping further behind. Versus last week’s baseline, the curve narrative shifted from duration-led leadership to a broader, more synchronized cooling.
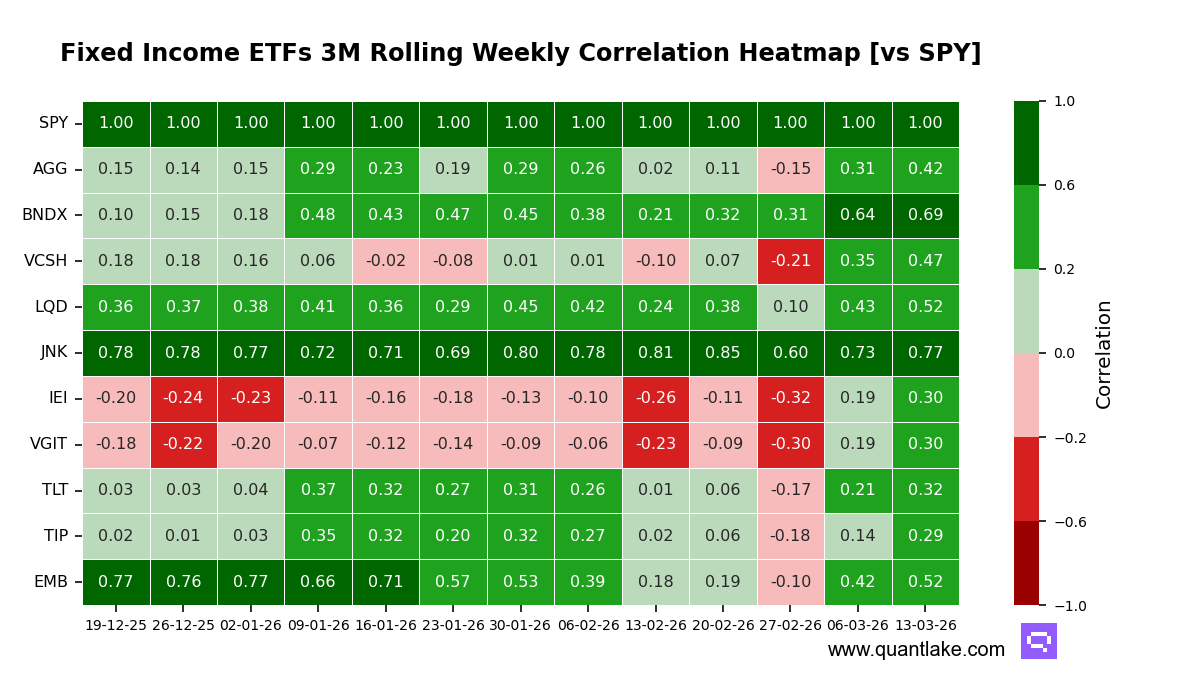
Linkage to the broad equity benchmark remains a key differentiator. Correlations now sit above their one-year norms across most rate-sensitive sleeves, signaling convergence and reducing their defensive character. Credit remains the most equity-sensitive pocket, preserving upside participation while limiting hedging effectiveness in equity drawdowns.
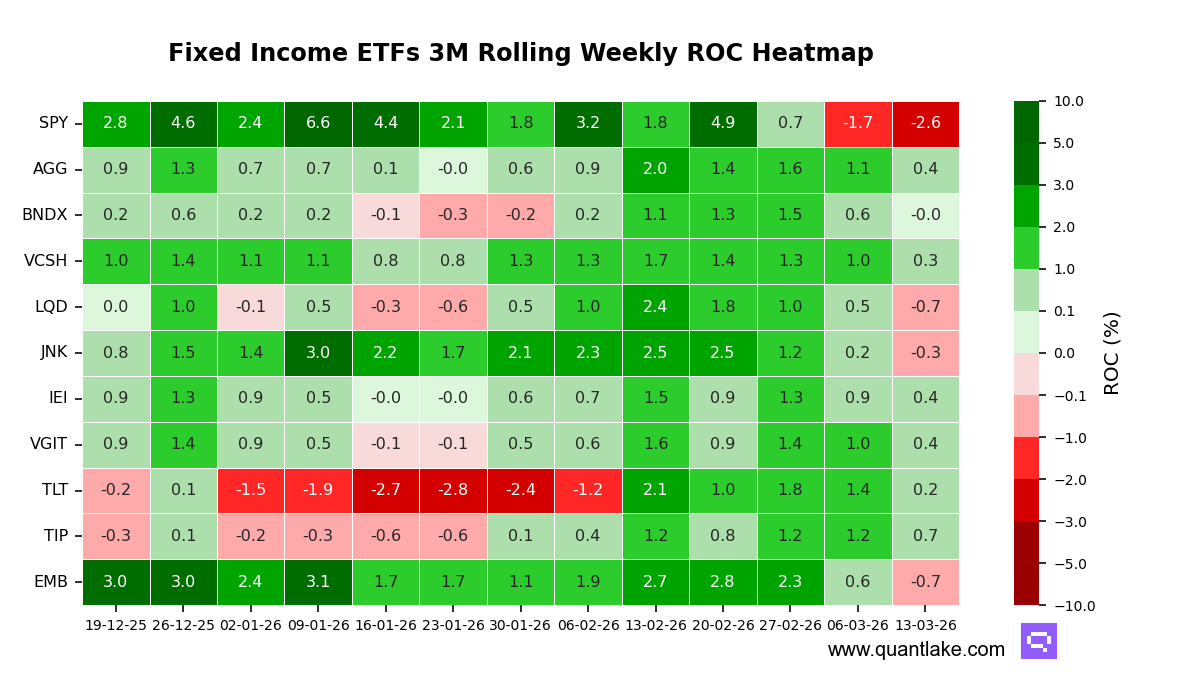
This week, breadth deteriorated versus the prior week: all 10 ETFs we track weakened on a three-month trailing basis. The smallest deteriorations came from SPDR Bloomberg High Yield Bond (JNK) at -0.5 points, iShares 3–7 Year Treasury Bond (IEI) at -0.5, and iShares TIPS Bond (TIP) at -0.5. The largest declines were iShares JPMorgan USD Emerging Markets Bond (EMB) at -1.3, iShares iBoxx $ Investment Grade Corporate Bond (LQD) at -1.2, and iShares 20+ Year Treasury Bond (TLT) at -1.2. JNK, LQD, EMB, and Vanguard Total International Bond (BNDX) flipped negative.
Leadership by level now clusters in the upper third around TIP at 0.7, with a mid-pack group at 0.4 that includes IEI, iShares Core US Aggregate Bond (AGG), and Vanguard Intermediate-Term Treasury (VGIT). TLT and Vanguard Short-Term Corporate Bond (VCSH) sit closer to the middle, while JNK, LQD, and EMB occupy the lower half.
Stretch is no longer benign. VCSH sits at a statistical floor with a -2.52 z-score, a setup where mean reversion pressure can dominate near-term momentum shifts. EMB (-1.85) and LQD (-1.52) also screen as depressed, while several funds sit near their 12-month troughs, including VCSH, LQD, and EMB.
Attribution is increasingly beta-aware rather than purely internal. TLT’s correlation to the broad equity benchmark is 0.32 versus a -0.10 one-year mean, a clear convergence that supports upside participation but reduces hedging value in drawdowns. JNK remains the most equity-sensitive at 0.77 versus a 0.74 mean, and its alpha contribution is modest at 0.4 points, consistent with beta-like behavior.
Our take: Last week’s duration-anchored framework looks less decisive, as this week’s sign flips in credit and the rise in equity linkage argue for treating fixed income leadership as more fragile and less defensive than our prior read implied.