.png)
Daily Tactical: Equity Recovery Turns Benchmark-Led
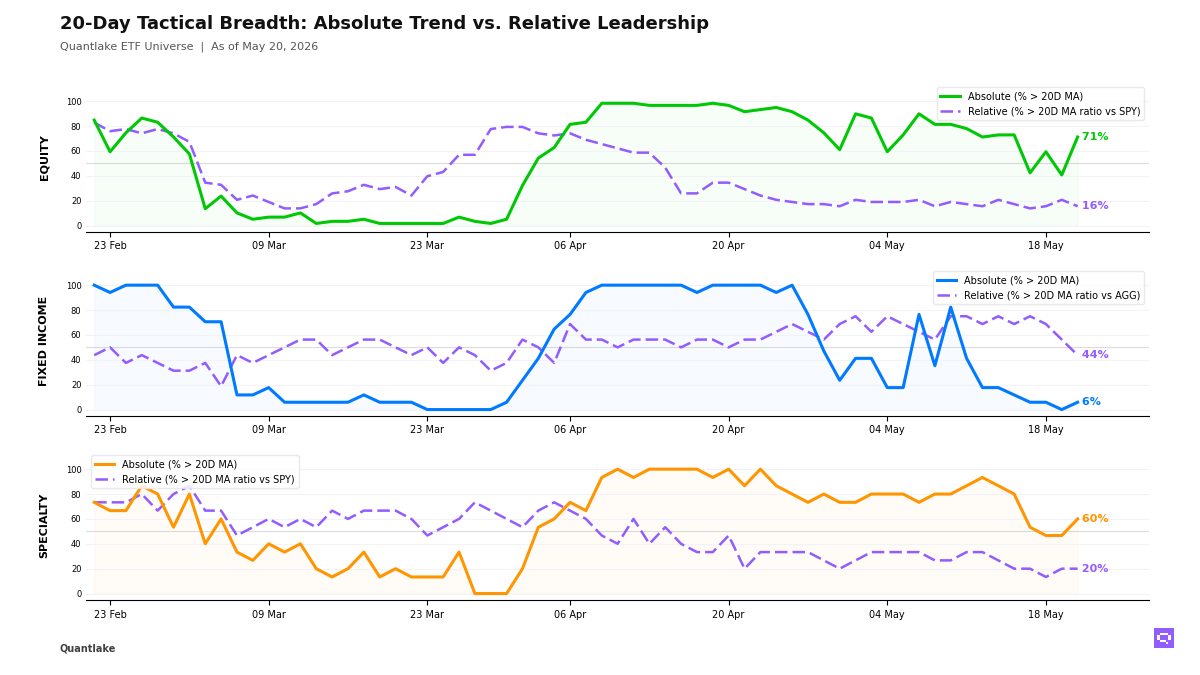
Price breadth jumped, while relative leadership thinned across our universe
At the close, equity participation broadened in price while leadership narrowed further across our ETF universe. 42 of 59 equity ETFs (71%, +30.5pp) held above their 20-day moving average, yet only 9 of 58 (16%, -5.2pp) beat the S&P 500 SPY, leaving a +56pp gap. The rebound spread into developed ex-US, emerging markets, low-volatility and value in price. Relative leadership stayed concentrated in US growth, technology, energy and South Korea. International and defensive exposures failed to confirm.
Fixed income stayed defensive. Just 1 of 17 bond ETFs (6%, +5.9pp) held above their 20-day moving average, while 7 of 16 (44%, -12.5pp) still outperformed the Aggregate Bonds AGG, leaving a -38pp gap. Short-duration and credit held relative ground even with most prices below their averages. Long-duration Treasuries continued to lose ground.
In specialty, momentum, semiconductors and clean energy remained the clearest relative winners versus the S&P 500 SPY, while real estate, min-vol and managed futures mostly represented price recovery without leadership. Commodities were selective across our coverage. Copper strengthened while oil and broad commodities slipped below their ratio moving averages versus the S&P 500 SPY, and agriculture fell back below its 20-day moving average.
20-Day Tactical Breadth
Key Takeaways
• The key equity tell is the composition of the recovery: Dow Jones DIA, High Dividend DVY and Emg. Markets EEM all reclaimed their 20-day moving averages, yet low-volatility, developed ex-US and much of that international rebound still lagged the S&P 500 SPY. Across timescales, durable relative leadership remains concentrated in South Korea, US growth and technology, and international value rather than in the broader cyclical or defensive groups that improved in price.
• Bonds split between duration and credit, not a broad upside turn. Global Bonds BNDX was the only fixed income name to close back above its 20-day moving average, while Corporate Credit VCIT crossed above its ratio moving average versus the Aggregate Bonds AGG and Muni Bonds MUB, TIPS TIP and Int. Treasuries VGIT crossed below theirs. Short-duration outperformance remains a stability signal. Continued weakness in intermediate and long Treasuries keeps rate-sensitive duration as the weak link.
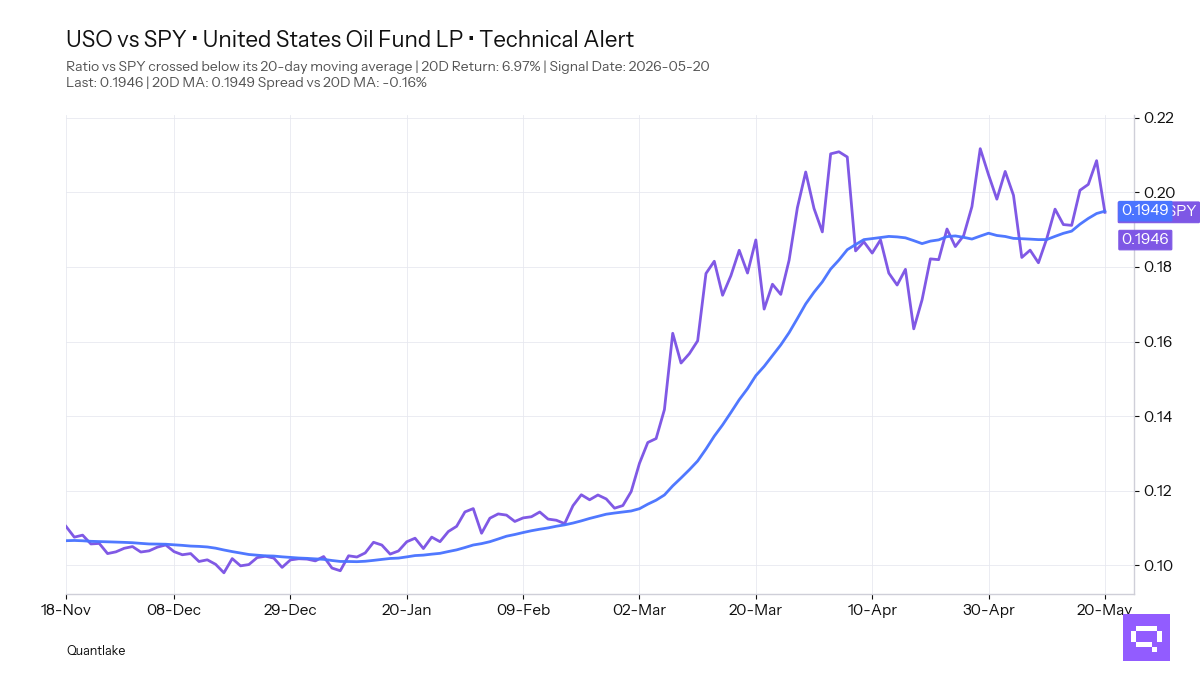
• In specialty and commodities, the relative upside stayed narrow. Momentum Factor MTUM and Clean Energy ICLN crossed above their ratio moving averages versus the S&P 500 SPY, while Managed Futures DBMF and Min Volatility USMV crossed below theirs. Against the S&P 500 SPY, Oil USO with a +6.97% period relative return versus SPY crossed below its 20-day ratio moving average. Copper CPER also crossed above both its 20-day moving average and its ratio moving average versus SPY, but its 20-day relative return remained -1.58%. We read that as early stabilization rather than established leadership.
FEATURED ETF — United States Oil Fund LP USO vs SPY
Other Technical Signal Events
EQUITY
↗ Price breakouts (cross-up 20D MA)
• XLF - Financial Select Sector · 20D perf: -1.05%
• EWU - iShares MSCI United Kingdom ETF · -0.19%
• VB - Vanguard Small-Cap · +0.14%
• IQLT - iShares MSCI Intl Quality Factor ETF · +0.51%
• VO - Vanguard Mid-Cap · +0.60%
• RSP - Invesco S&P 500® Equal Weight ETF · +0.68%
• DVY - iShares Select Dividend ETF · +0.93%
• DIA - SPDR Dow Jones Industrial Average ETF · +1.16%
• IWM - iShares Russell 2000 ETF · +1.23%
• VGK - Vanguard FTSE Europe · +1.26%
• EWG - iShares MSCI Germany ETF · +1.32%
• MDYG - SPDR® S&P 400 Mid Cap Growth ETF · +1.35%
• EFA - iShares MSCI EAFE ETF · +1.62%
• IMTM - iShares MSCI Intl Momentum Factor ETF · +1.65%
• XLRE - SPDR Real Estate Select ETF · +2.23%
• VEA - Vanguard FTSE Developed Markets · +2.71%
• EEM - iShares MSCI Emerging Markets ETF · +3.28%
• EWT - iShares MSCI Taiwan ETF · +6.65%
↘ Price breakdowns (cross-down 20D MA)
None on the close
↗ Leadership gains (cross-up 20D MA vs SPY)
• IVLU - iShares Edge MSCI Intl Value Factor ETF · 20D relative perf: -0.69%
↘ Leadership losses (cross-down 20D MA vs SPY)
• XLP - Consumer Staples Select Sector · 20D relative perf: unch.
• SCHD - Schwab U.S. Dividend Equity ETF · -0.62%
• ACWV - iShares MSCI Global Min Vol Factor ETF · -2.84%
• XLV - Health Care Select Sector · -3.56%
FIXED INCOME
↗ Price breakouts (cross-up 20D MA)
• BNDX - Vanguard Total International Bond · 20D perf: -0.31%
↘ Price breakdowns (cross-down 20D MA)
None on the close
↗ Leadership gains (cross-up 20D MA vs AGG)
• VCIT - Vanguard Intermediate-Term Corporate Bond · 20D relative perf: unch.
↘ Leadership losses (cross-down 20D MA vs AGG)
• TIP - iShares TIPS Bond ETF · 20D relative perf: +0.66%
• MUB - iShares National Muni Bond ETF · unch.
• VGIT - Vanguard Intermediate-Term Treasury · unch.
SPECIALTY
↗ Price breakouts (cross-up 20D MA)
• REET - iShares Global REIT ETF · 20D perf: +1.97%
• VNQ - Vanguard Real Estate ETF · +2.08%
↘ Price breakdowns (cross-down 20D MA)
None on the close
↗ Leadership gains (cross-up 20D MA vs SPY)
• ICLN - iShares Global Clean Energy ETF · 20D relative perf: +4.02%
• MTUM - iShares MSCI USA Momentum Factor ETF · +4.15%
↘ Leadership losses (cross-down 20D MA vs SPY)
• DBMF - iMGP DBi Managed Futures Strategy ETF · 20D relative perf: -1.84%
• USMV - iShares MSCI USA Min Vol Factor ETF · -2.21%
COMMODITIES
↗ Price breakouts (cross-up 20D MA)
• CPER - United States Copper LP · 20D perf: +2.58%
↘ Price breakdowns (cross-down 20D MA)
• DBA - Invesco DB Agriculture · 20D perf: +3.10%
↗ Leadership gains (cross-up 20D MA vs SPY)
• CPER - United States Copper LP · 20D relative perf: -1.58%
↘ Leadership losses (cross-down 20D MA vs SPY)
• USO - United States Oil Fund LP · 20D relative perf: +6.97%
• PDBC - Invesco Optimum Yield Diversified Commodity Strategy No K-1 ETF · +0.47%
Romain Gandon
CEO, Quantlake
Disclaimer: This article is for informational and educational purposes only and does not constitute investment advice. Past performance is not indicative of future results.