.png)

ACWV grinds 2% above its 10-month SMA near its Feb high
Trend & Momentum
iShares MSCI Global Min Vol Factor ETF holds a steady long-term uptrend, trading at $122.22, 2.0% above its 10-month SMA at $119.8. The average is up 1.2% over three months. Price has held above its 10-month SMA since November 2023, a 32-month tenure. The advance leveled off after prior gains: 3M +1.9%, 6M +2.1%, and 12M +7.2%; 1M +1.7% adds a small recent lift. Over the past 12 months, ACWV rose from its August 2025 low of $114.14 to its February 2026 high of $124.19. 1Y realized volatility runs at 7.7%, against the 3Y average of 8.2% (z-score -0.6). The setup is an intact uptrend with a muted pace and a low-volatility profile.

Relative Strength & Market Sensitivity
ACWV trails the benchmark. The ACWV/SPY ratio, indexed to 100 at August 2021, stands 4.6% below its 10-month ratio SMA. Its ratio SMA is down 3.4% over three months, and the ratio trails by 28.0% since the base. Relative pressure eased, with excess return at -2.5% over 3M and -10.6% over 12M. After its 12-month ratio high in August 2025, the ratio has risen 1.8% from its May 2026 12-month low. Relative underperformance is stabilizing.

Risk & Macro Sensitivity
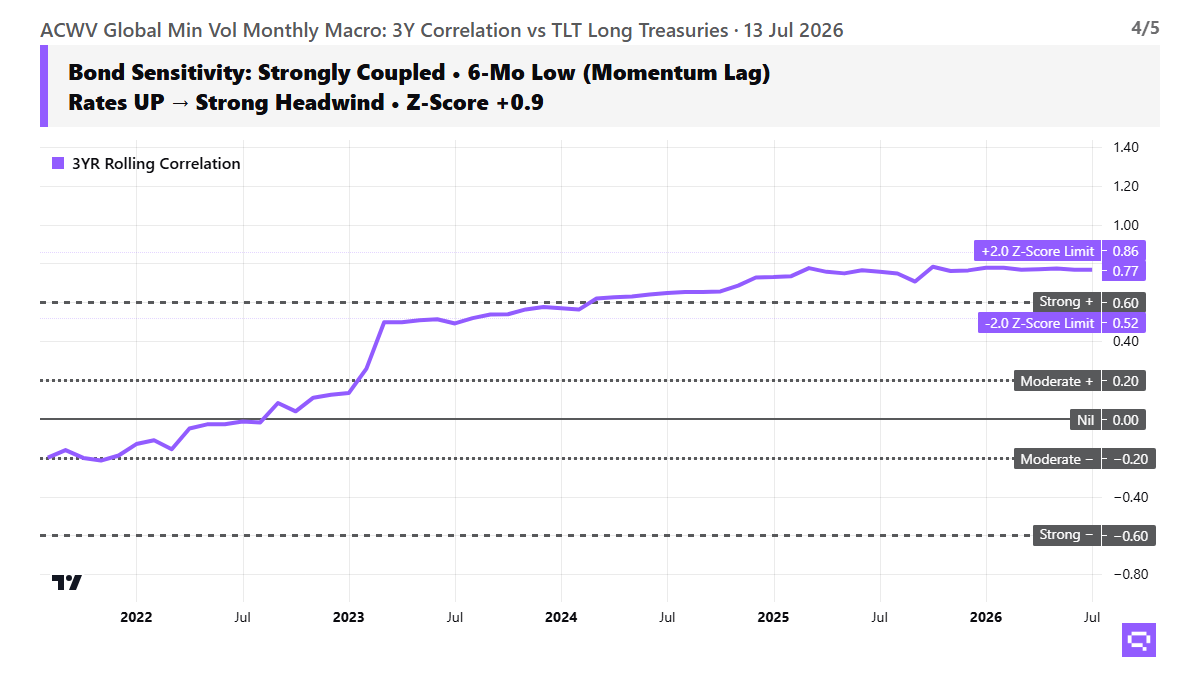
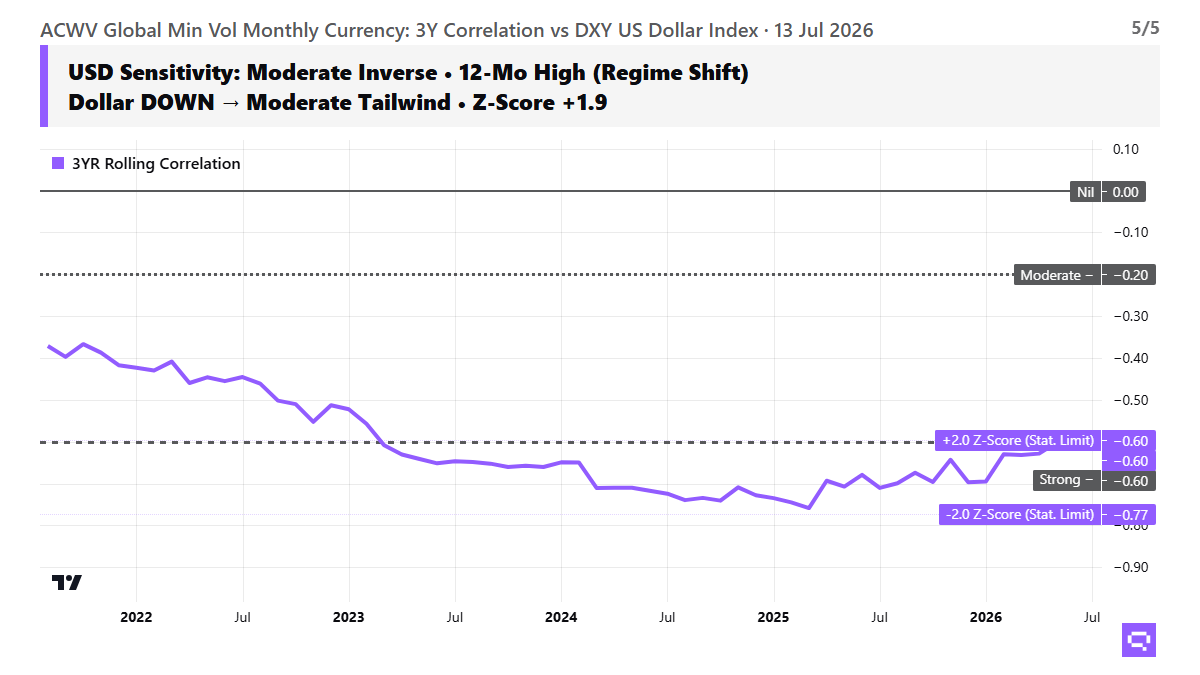
ACWV reads defensive, with 3Y beta at 0.36 and 3Y Sortino at 1.87. On the rate side, the fund's 0.77 3Y correlation to Long Treasuries TLT is strong; TLT is 2.3% below its 10-month SMA, which leaves a headwind. On the dollar side, the fund's 3Y correlation to the US Dollar Index DXY is -0.60; DXY is 2.2% above its 10-month SMA, a moderate headwind. Risk structure reads defensive and efficient over the cycle.

Romain Gandon
CEO, Quantlake
Disclaimer: This article is for informational and educational purposes only and does not constitute investment advice. Past performance is not indicative of future results.
Glossary
10-month moving average (SMA): A long-term trend filter popularized by Meb Faber's tactical asset allocation research. It averages the trailing 10 months of closing prices. Price above the line points to a structural uptrend; price below points to a downtrend.
SMA slope: The rate of change in the moving average line itself over a specific timeframe (such as three months). A flat slope confirms a trendless consolidation; a steepening slope confirms that trend momentum is accelerating.
Beta: A measure of an asset's co-movement with the S&P 500. A beta of 1.0 means the fund moves roughly in step with the market average; above 1.0 means it tends to swing harder than the market in both directions; below 1.0 means its swings are dampened. Beta measures market sensitivity, not the independent size of the fund's own price swings (which is volatility).
Excess return: The fund's net return minus the S&P 500's return over an identical timeframe. This is cumulative over each specific window (1M, 3M, 6M, 12M) and is not annualized. It serves as the baseline measure for relative strength.
Indexed to 100: A method of rebasing the fund-to-S&P 500 ratio to a fixed reference date (such as June 2021 = 100) to make relative changes easier to read. Today's value reads directly as the cumulative percentage change in relative strength since that anchor. A reading of 115 means the fund has beaten the market by 15% since the starting date.
Realized volatility: The standard deviation of a fund's actual monthly returns over a trailing 1-year window, multiplied by the square root of 12 to express it as an annual figure for easier comparison. Higher percentages imply wider price swings.
Sortino ratio (Downside efficiency): A risk-adjusted performance measure that only penalizes negative swings (losses) rather than general volatility. It measures the excess return earned per unit of downside risk. As a rough guide, readings above 1.0 are solid and above 2.0 are strong, though thresholds vary by asset class. Reported on a 3-year rolling window as the full-cycle benchmark.
Z-score: A statistical measure showing how far a current price or ratio sits from its own 3-year rolling average, measured in standard deviation units. Readings beyond +/-2 are statistically unusual; whether the data point reverts to the mean or continues to stretch depends on whether the prevailing trend is intact or weakening.
Correlation: A mathematical value from -1.0 to +1.0 measuring the consistency and direction of co-movement between two assets. +1 means they move in lockstep; -1 means they move in opposite directions; 0 means no consistent relationship. Correlation describes the direction and consistency of the move, not the absolute size of the price impact.
Headwind / Tailwind: An assessment of whether the macro environment is currently working for or against a fund. It is built from two distinct inputs: (1) how the fund correlates with a macro asset like Treasuries (TLT) or the US Dollar (DXY), and (2) whether that macro asset is itself in an absolute uptrend or downtrend. A fund positively correlated with bonds gets a tailwind when bonds are rising and a headwind when bonds are falling. A fund negatively correlated experiences the exact inverse.
Lookback window: The specific historical timeframe used to calculate a metric (such as the 1-year and 3-year windows). Shorter windows are highly sensitive to recent momentum shifts; longer windows smooth out noise but blend together multiple market environments.